

Question: IN - CLASS ASSIGNMENT Design a User - Defined Function as shown in the lecture prior to the midterm that calculates the data rate of
INCLASS ASSIGNMENT
Design a UserDefined Function as shown in the lecture prior to the midterm that calculates the data rate of a G cell phone user based on the following equation also known as the ShannonHartley Theorem:
Data Rate Bandwidth Transmission PowerBandwidth
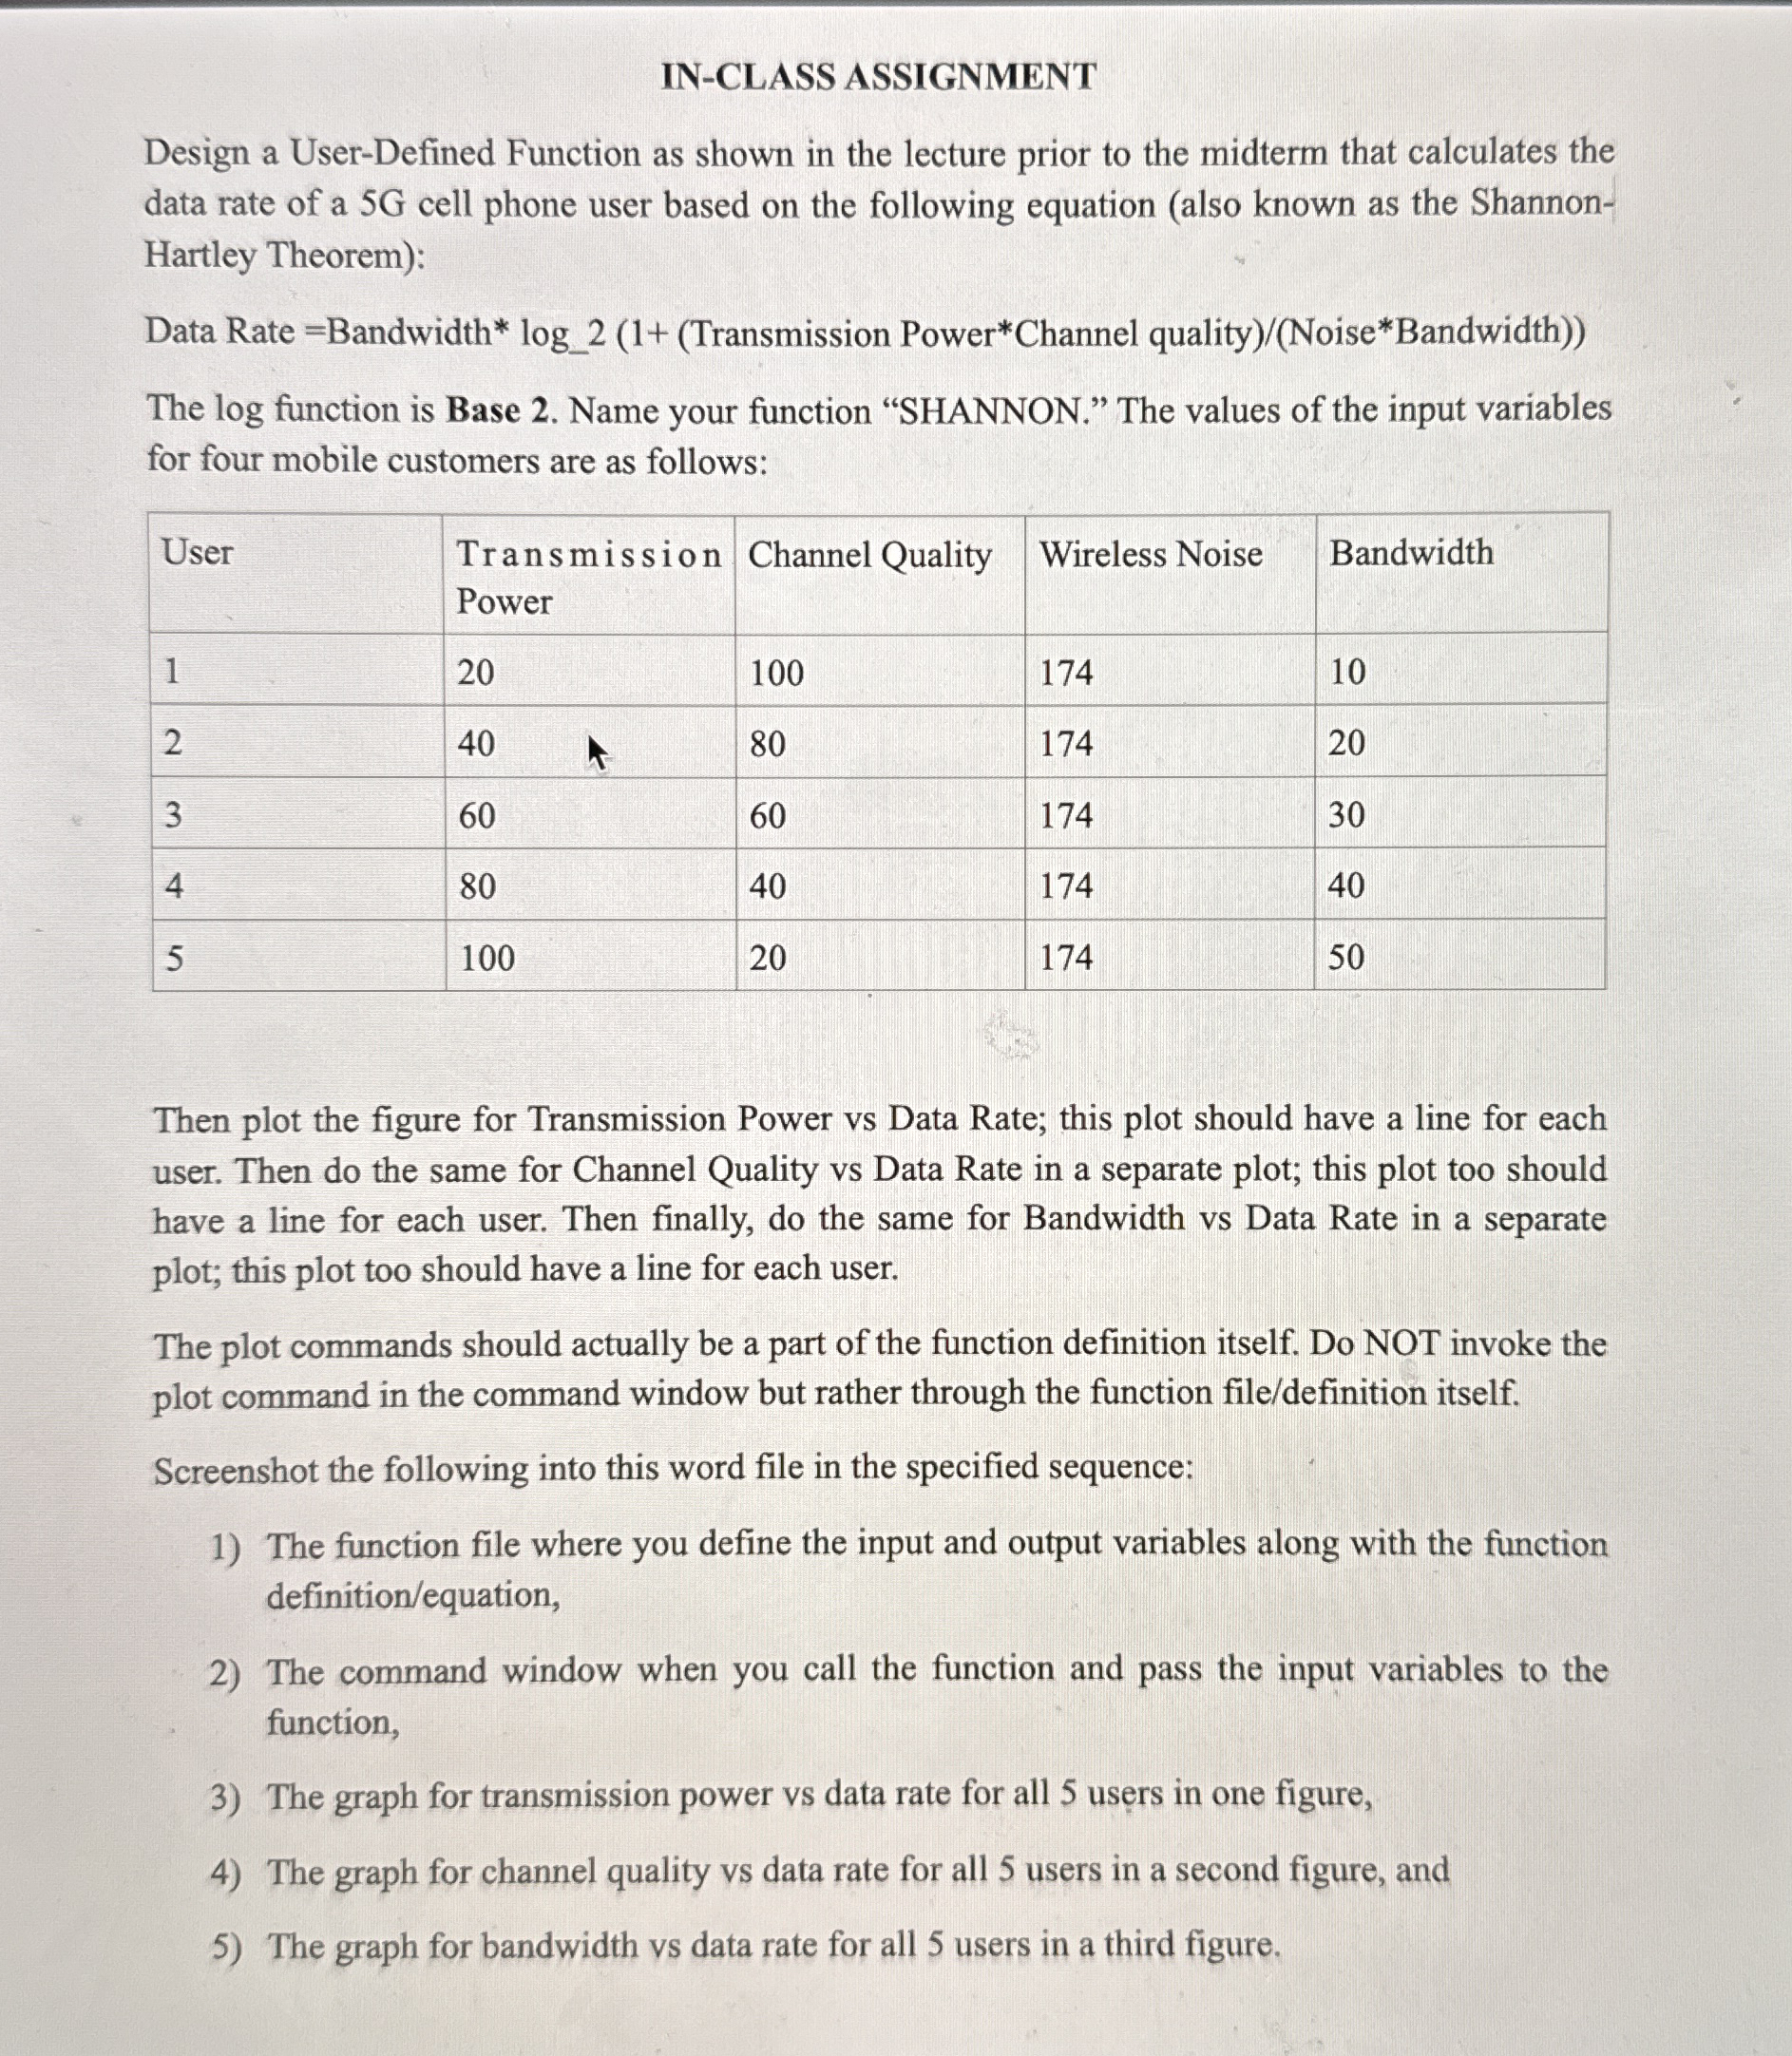
The log function is Base Name your function "SHANNON." The values of the input variables for four mobile customers are as follows:
tableUsertableTransmissionPowerChannel Quality,Wireless Noise,Bandwidth
Then plot the figure for Transmission Power vs Data Rate; this plot should have a line for each user. Then do the same for Channel Quality vs Data Rate in a separate plot; this plot too should have a line for each user. Then finally, do the same for Bandwidth vs Data Rate in a separate plot; this plot too should have a line for each user.
The plot commands should actually be a part of the function definition itself. Do NOT invoke the plot command in the command window but rather through the function filedefinition itself.
Screenshot the following into this word file in the specified sequence:
The function file where you define the input and output variables along with the function definitionequation
The command window when you call the function and pass the input variables to the function,
The graph for transmission power vs data rate for all users in one figure,
The graph for channel quality vs data rate for all users in a second figure, and
The graph for bandwidth vs data rate for all users in a third figure.
Step by Step Solution
There are 3 Steps involved in it
1 Expert Approved Answer
Step: 1 Unlock

Question Has Been Solved by an Expert!
Get step-by-step solutions from verified subject matter experts
Step: 2 Unlock
Step: 3 Unlock