

Question: In many experiments, a velocity versus position (v-s) profile is obtained. v (ft/s) -v = 0.6 s4 75- If we have a v-s graph
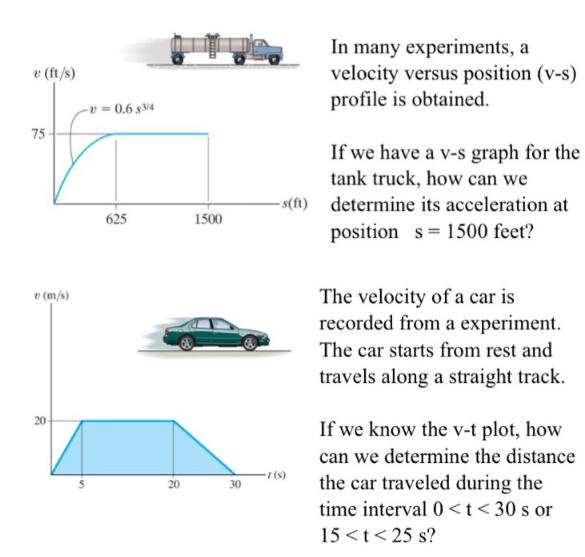
In many experiments, a velocity versus position (v-s) profile is obtained. v (ft/s) -v = 0.6 s4 75- If we have a v-s graph for the tank truck, how can we determine its acceleration at -s(ft) 1500 625 position s= 1500 feet? v (m/s) The velocity of a car is recorded from a experiment. The car starts from rest and travels along a straight track. 20 If we know the v-t plot, how can we determine the distance the car traveled during the time interval 0
Step by Step Solution
3.39 Rating (155 Votes )
There are 3 Steps involved in it
To solve this problem well tackle each question separately 1 Acceleration of the Tank Truck at s 150... View full answer

Get step-by-step solutions from verified subject matter experts