

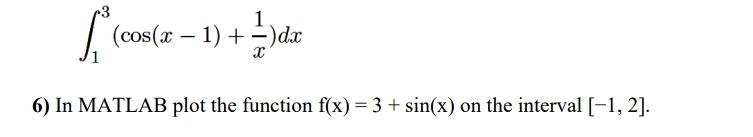
Question: In MATLAB plot the function f ( x ) = 3 + s i n ( x ) on the interval - 1 , 2
In MATLAB plot the function on the interval
Step by Step Solution
There are 3 Steps involved in it
1 Expert Approved Answer
Step: 1 Unlock

Question Has Been Solved by an Expert!
Get step-by-step solutions from verified subject matter experts
Step: 2 Unlock
Step: 3 Unlock