

Question: In MATLAB, write a scrpit that will create a MATLAB function MySinc() that defines sinc(x) function following the above definition. Plot tje value sinc(x) in
In MATLAB, write a scrpit that will create a MATLAB function MySinc() that defines sinc(x) function following the above definition. Plot tje value sinc(x) in the interval [-2pi, 2pi] using MySinc() function and MATLAB inbuilt sinc() function on the same graph
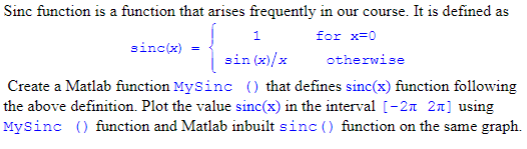
Sinc function is a function that arises frequently in our course. It is defined as 1 for x- sinc(x) | = sin(x)/x otherwise Create a Matlab function Mysinc that defines sinc(x) function following the above definition. Plot the value sinc(X) in the interval [-2n 2 using Mysinc ) function and Matlab inbuilt sinc function on the same graph. Sinc function is a function that arises frequently in our course. It is defined as 1 for x- sinc(x) | = sin(x)/x otherwise Create a Matlab function Mysinc that defines sinc(x) function following the above definition. Plot the value sinc(X) in the interval [-2n 2 using Mysinc ) function and Matlab inbuilt sinc function on the same graph
Step by Step Solution
There are 3 Steps involved in it

Get step-by-step solutions from verified subject matter experts