

Question: In Problems 6-12, construct a scatterplot of the given data. Is there a trend in the data? Are any of the data points outliers?
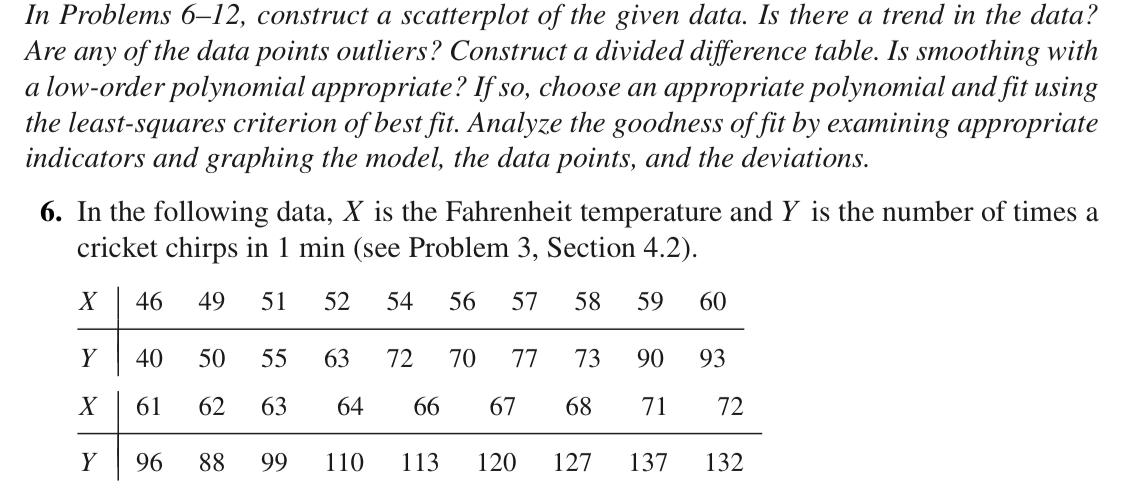
In Problems 6-12, construct a scatterplot of the given data. Is there a trend in the data? Are any of the data points outliers? Construct a divided difference table. Is smoothing with a low-order polynomial appropriate? If so, choose an appropriate polynomial and fit using the least-squares criterion of best fit. Analyze the goodness of fit by examining appropriate indicators and graphing the model, the data points, and the deviations. 6. In the following data, X is the Fahrenheit temperature and Y is the number of times a cricket chirps in 1 min (see Problem 3, Section 4.2). 46 49 51 52 54 56 57 58 59 60 Y 40 50 55 63 72 70 77 73 90 93 61 62 63 64 66 67 68 71 72 Y 96 88 99 110 113 120 127 137 132
Step by Step Solution
3.48 Rating (168 Votes )
There are 3 Steps involved in it

Get step-by-step solutions from verified subject matter experts