

Question: in python. parts b and c please x = (0.0, 0.5, 1.0, 1.5, 2.0, 2.5), a) Plot the polynomial P over the range [0, 3
in python.
parts b and c please
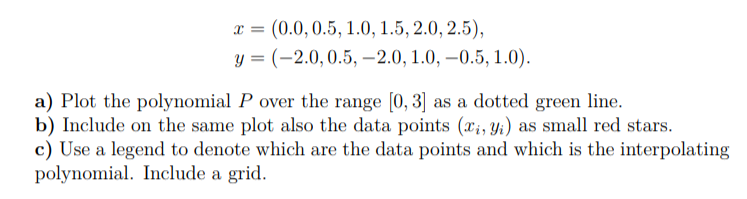
x = (0.0, 0.5, 1.0, 1.5, 2.0, 2.5), a) Plot the polynomial P over the range [0, 3 as a dotted green line b) Include on the same plot also the data points (ri,%) as small red stars. c) Use a legend to denote which are the data points and which is the interpolating polynomial. Include a grid
Step by Step Solution
There are 3 Steps involved in it
1 Expert Approved Answer
Step: 1 Unlock

Question Has Been Solved by an Expert!
Get step-by-step solutions from verified subject matter experts
Step: 2 Unlock
Step: 3 Unlock