

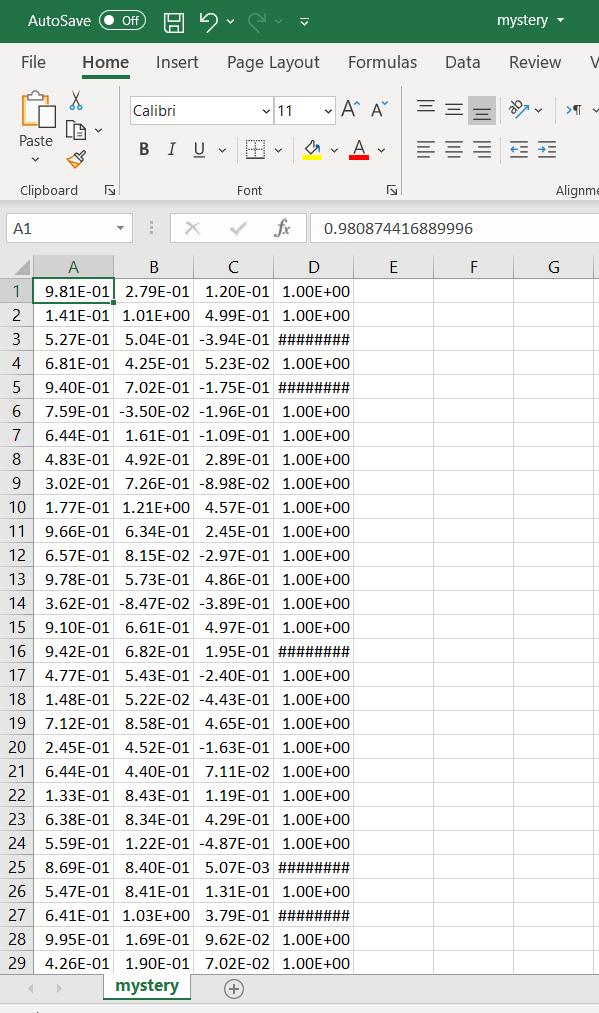
Question: In python please only numpy and Matplotlib packages are allowed to use! the last picture of excel is meant for the second question, while the
In python please
only numpy and Matplotlib packages are allowed to use!
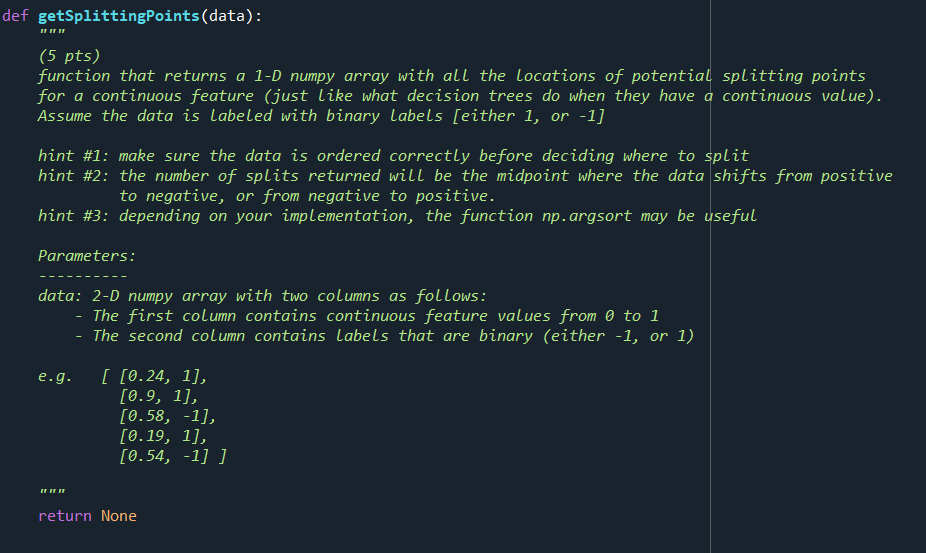
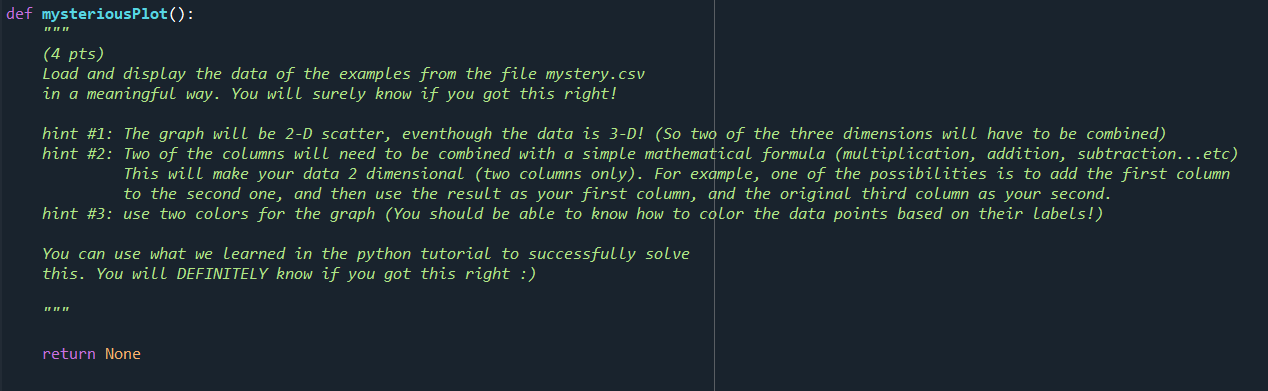
def getsplittingPoints(data): IF IT IT (5 pts) function that returns a 1-D numpy array with all the locations of potential splitting points for a continuous feature (just like what decision trees do when they have a continuous value). Assume the data is labeled with binary Labels [either 1, or -1] hint #1: make sure the data is ordered correctly before deciding where to split hint #2: the number of splits returned will be the midpoint where the data shifts from positive to negative, or from negative to positive. hint #3: depending on your implementation, the function np.argsort may be useful Parameters: data: 2-D numpy array with two columns as follows: The first column contains continuous feature values from 0 to 1 The second column contains Labels that are binary (either -1, or 1) e.g. [ [0.24, 1], [0.9, 1], [0.58, -1], [0.19, 1], [0.54, -1] ] IT IT IT return None def mysteriousPlot(): (4 pts) Load and display the data of the examples from the file mystery.csv in a meaningful way. You will surely know if you got this right! hint #1: The graph will be 2-D scatter, eventhough the data is 3-D! (So two of the three dimensions will have to be combined) hint #2: Two of the columns will need to be combined with a simple mathematical formula (multiplication, addition, subtraction...etc) This will make your data 2 dimensional (two columns only). For example, one of the possibilities is to add the first column to the second one, and then use the result as your first column, and the original third column as your second. hint #3: use two colors for the graph (You should be able to know how to color the data points based on their Labels!) You can use what we learned in the python tutorial to successfully solve this. You will DEFINITELY know if you got this right :) return None AutoSave Off mystery File Home Insert Page Layout Formulas Data Review V X LO Calibri - 11 ~A == > Paste MA + + V Clipboard Font Alignme A1 X fic 0.980874416889996 E F G A B D 1 9.81E-01 2.79E-01 1.20E-01 1.00E+00 2 1.41E-01 1.01E+00 4.99E-01 1.00E+00 3 5.27E-01 5.04E-01 -3.94E-01 ######## 4 6.81E-01 4.25E-01 5.23E-02 1.00E+00 5 9.40E-01 7.02E-01 -1.75E-01 ######## 6 7.59E-01 -3.50E-02 -1.96E-01 1.00E+00 7 6.44E-01 1.61E-01 -1.09E-01 1.00E+00 8 4.83E-01 4.92E-01 2.89E-01 1.00E+00 9 3.02E-01 7.26E-01 -8.98E-02 1.00E+00 10 1.77E-01 1.21E+00 4.57E-01 1.00E+00 11 9.66E-01 6.34E-01 2.45E-01 1.00E+00 12 6.57E-01 8.15E-02 -2.97E-01 1.00E+00 13 9.78E-01 5.73E-01 4.86E-01 1.00E+00 14 3.62E-01 -8.47E-02 -3.89E-01 1.00E+00 15 9.10E-01 6.61E-01 4.97E-01 1.00E+00 16 9.42E-01 6.82E-01 1.95E-01 ######## 17 4.77E-01 5.43E-01 -2.40E-01 1.00E+00 18 1.48E-01 5.22E-02 -4.43E-01 1.00E+00 19 7.12E-01 8.58E-01 4.65E-01 1.00E+00 20 2.45E-01 4.52E-01 -1.63E-01 1.00E+00 21 6.44E-01 4.40E-01 7.11E-02 1.00E+00 22 1.33E-01 8.43E-01 1.19E-01 1.00E+00 23 6.38E-01 8.34E-01 4.29E-01 1.00E+00 24 5.59E-01 1.22E-01 -4.87E-01 1.00E+00 25 8.69E-01 8.40E-01 5.07E-03 ######## 26 5.47E-01 8.41E-01 1.31E-01 1.00E+00 27 6.41E-01 1.03E+00 3.79E-01 ######## 28 9.95E-01 1.69E-01 9.62E-02 1.00E+00 29 4.26E-01 1.90E-01 7.02E-02 1.00E+00 mystery def getsplittingPoints(data): IF IT IT (5 pts) function that returns a 1-D numpy array with all the locations of potential splitting points for a continuous feature (just like what decision trees do when they have a continuous value). Assume the data is labeled with binary Labels [either 1, or -1] hint #1: make sure the data is ordered correctly before deciding where to split hint #2: the number of splits returned will be the midpoint where the data shifts from positive to negative, or from negative to positive. hint #3: depending on your implementation, the function np.argsort may be useful Parameters: data: 2-D numpy array with two columns as follows: The first column contains continuous feature values from 0 to 1 The second column contains Labels that are binary (either -1, or 1) e.g. [ [0.24, 1], [0.9, 1], [0.58, -1], [0.19, 1], [0.54, -1] ] IT IT IT return None def mysteriousPlot(): (4 pts) Load and display the data of the examples from the file mystery.csv in a meaningful way. You will surely know if you got this right! hint #1: The graph will be 2-D scatter, eventhough the data is 3-D! (So two of the three dimensions will have to be combined) hint #2: Two of the columns will need to be combined with a simple mathematical formula (multiplication, addition, subtraction...etc) This will make your data 2 dimensional (two columns only). For example, one of the possibilities is to add the first column to the second one, and then use the result as your first column, and the original third column as your second. hint #3: use two colors for the graph (You should be able to know how to color the data points based on their Labels!) You can use what we learned in the python tutorial to successfully solve this. You will DEFINITELY know if you got this right :) return None AutoSave Off mystery File Home Insert Page Layout Formulas Data Review V X LO Calibri - 11 ~A == > Paste MA + + V Clipboard Font Alignme A1 X fic 0.980874416889996 E F G A B D 1 9.81E-01 2.79E-01 1.20E-01 1.00E+00 2 1.41E-01 1.01E+00 4.99E-01 1.00E+00 3 5.27E-01 5.04E-01 -3.94E-01 ######## 4 6.81E-01 4.25E-01 5.23E-02 1.00E+00 5 9.40E-01 7.02E-01 -1.75E-01 ######## 6 7.59E-01 -3.50E-02 -1.96E-01 1.00E+00 7 6.44E-01 1.61E-01 -1.09E-01 1.00E+00 8 4.83E-01 4.92E-01 2.89E-01 1.00E+00 9 3.02E-01 7.26E-01 -8.98E-02 1.00E+00 10 1.77E-01 1.21E+00 4.57E-01 1.00E+00 11 9.66E-01 6.34E-01 2.45E-01 1.00E+00 12 6.57E-01 8.15E-02 -2.97E-01 1.00E+00 13 9.78E-01 5.73E-01 4.86E-01 1.00E+00 14 3.62E-01 -8.47E-02 -3.89E-01 1.00E+00 15 9.10E-01 6.61E-01 4.97E-01 1.00E+00 16 9.42E-01 6.82E-01 1.95E-01 ######## 17 4.77E-01 5.43E-01 -2.40E-01 1.00E+00 18 1.48E-01 5.22E-02 -4.43E-01 1.00E+00 19 7.12E-01 8.58E-01 4.65E-01 1.00E+00 20 2.45E-01 4.52E-01 -1.63E-01 1.00E+00 21 6.44E-01 4.40E-01 7.11E-02 1.00E+00 22 1.33E-01 8.43E-01 1.19E-01 1.00E+00 23 6.38E-01 8.34E-01 4.29E-01 1.00E+00 24 5.59E-01 1.22E-01 -4.87E-01 1.00E+00 25 8.69E-01 8.40E-01 5.07E-03 ######## 26 5.47E-01 8.41E-01 1.31E-01 1.00E+00 27 6.41E-01 1.03E+00 3.79E-01 ######## 28 9.95E-01 1.69E-01 9.62E-02 1.00E+00 29 4.26E-01 1.90E-01 7.02E-02 1.00E+00 mystery
Step by Step Solution
There are 3 Steps involved in it

Get step-by-step solutions from verified subject matter experts