

Question: In Table 6.1, why would it be problematic to calculate the mean value of the variable Religious Identification? with which it occurs (in absolute number
In Table 6.1, why would it be problematic to calculate the mean value of the variable "Religious Identification"?
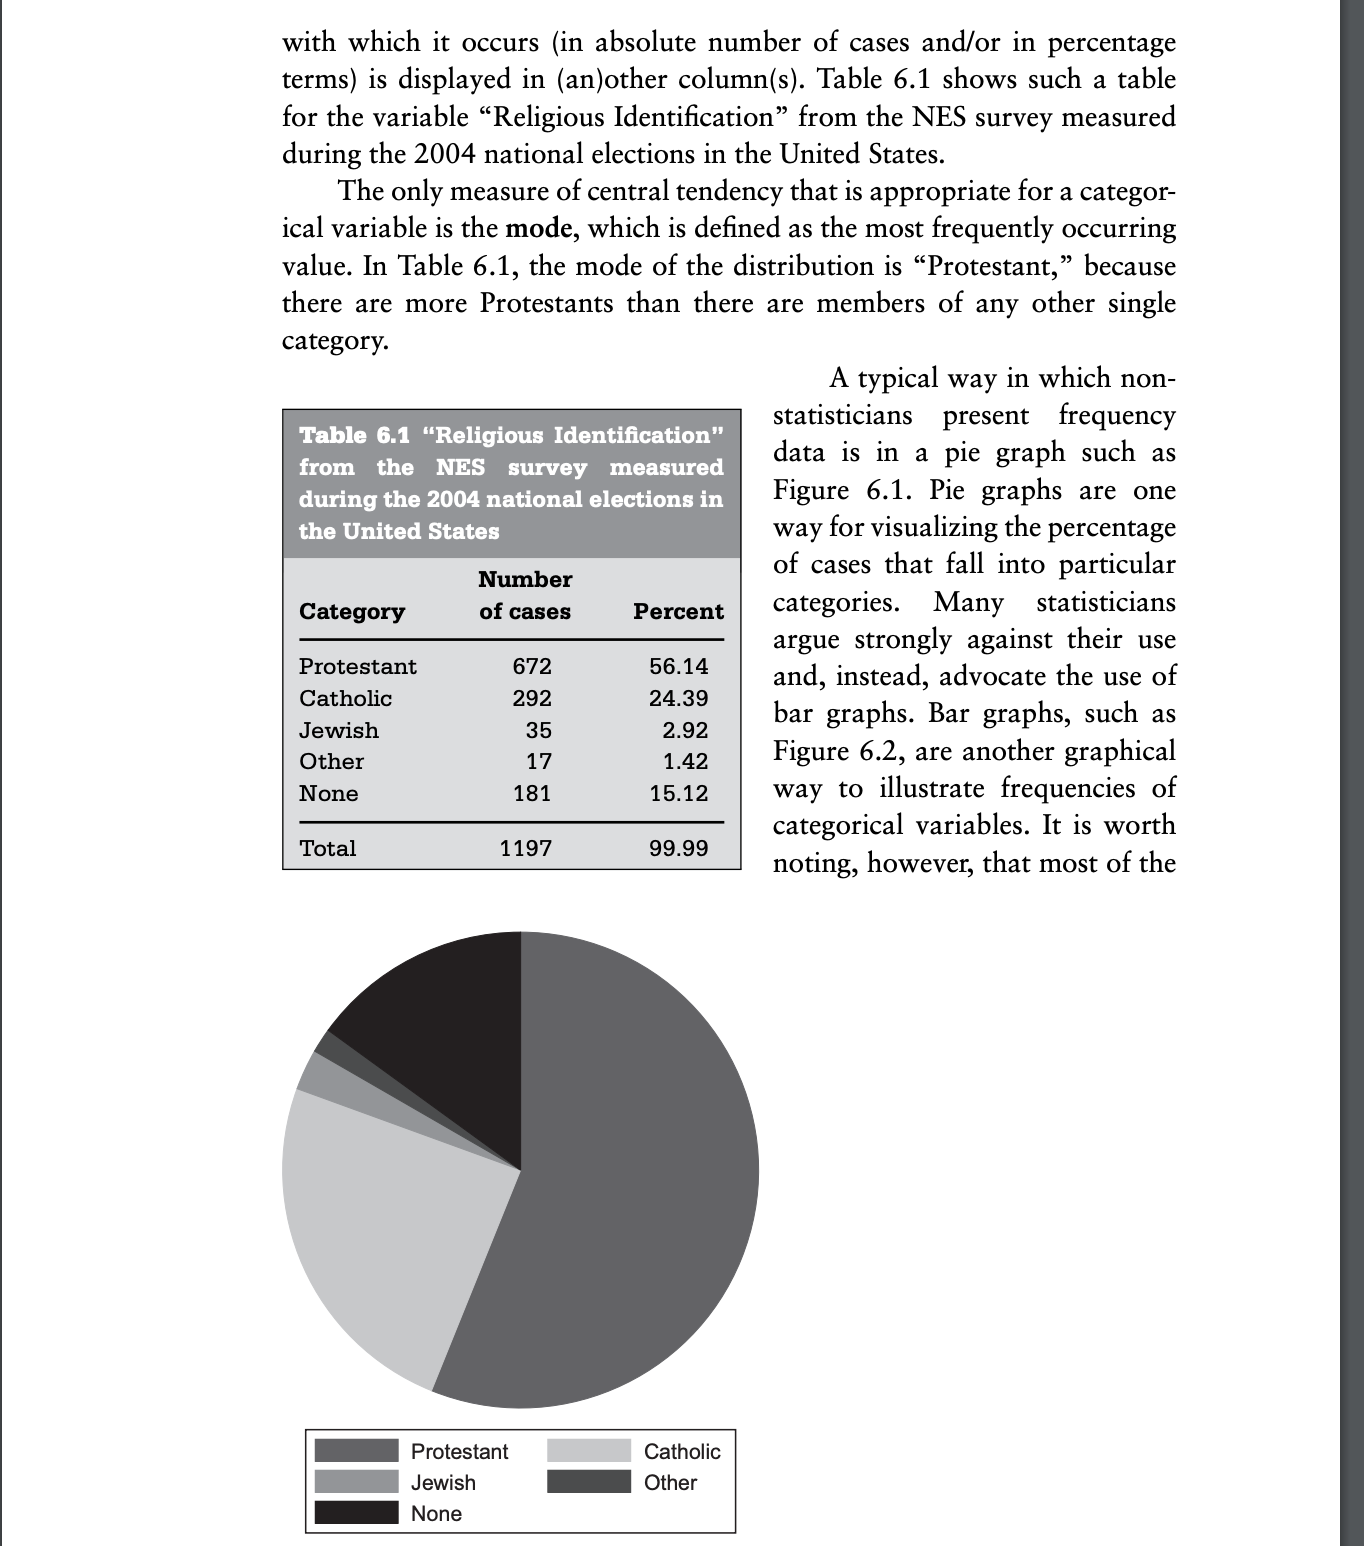
with which it occurs (in absolute number of cases andfor in percentage terms) is displayed in (an)other column(s). Table 6.1 shows such a table for the variable \"Religious Identication\" from the NES survey measured during the 2004 national elections in the United States. The only measure of central tendency that is appropriate for a categor ical variable is the mode, which is dened as the most frequently occurring value. In Table 6.1, the mode of the distribution is \"Protestant,\" because there are more Protestants than there are members of any other single category. A typical way in which non- statisticians present frequency Table 6.1 \"Religious Identication" . . . data 15 In a pie graph such as from the NES survey measured during the 2004 national elections in Figure 6-1- Pic graphs are one the United States way for visualizing the percentage N I\" of cases that fall into particular Category of cases Percent categories. Many statisticians argue strongly against their use and, instead, advocate the use of bar graphs. Bar graphs, such as Protestant 6'72 56.14 Catholic 292 24.39 Jewish 35 2.92 . _ Other 17 1.42 Figure 6.2, are another graphical None 15.12 way to illustrate frequencies of categorical variables. It is worth noting, however, that most of the Total 99.99 _ Protestant Catholic _ Jewish _ Other _ None
Step by Step Solution
There are 3 Steps involved in it

Get step-by-step solutions from verified subject matter experts