

Question: In technical communication, data is often represented visually, perhaps through the use of graphs, tables, or charts. This discussion topic is designed to give you
In technical communication, data is often represented visually, perhaps through the use of graphs, tables, or charts. This discussion topic is designed to give you practice in identifying flaws in data visualization.
In completing this discussion topic, you will first want to peruse the three resources in the section titledVisualization of Data inContent for week 7.
For each of the following four questions, a couple of sentences.
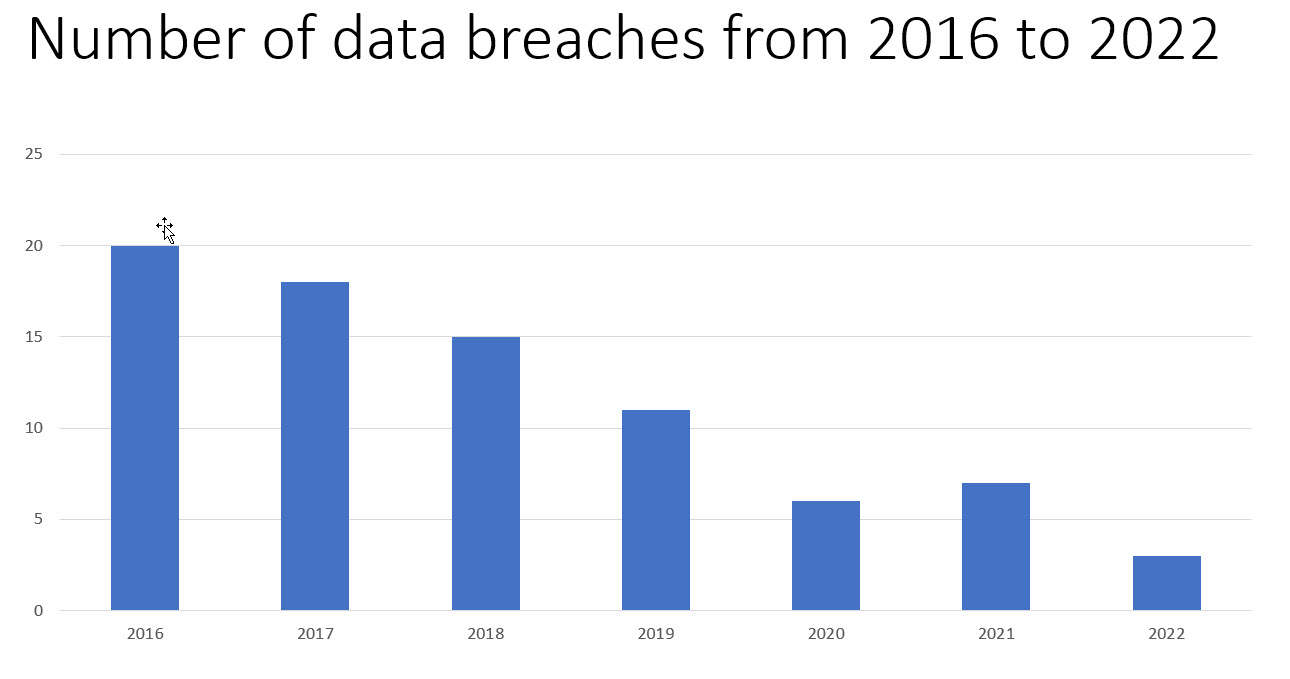
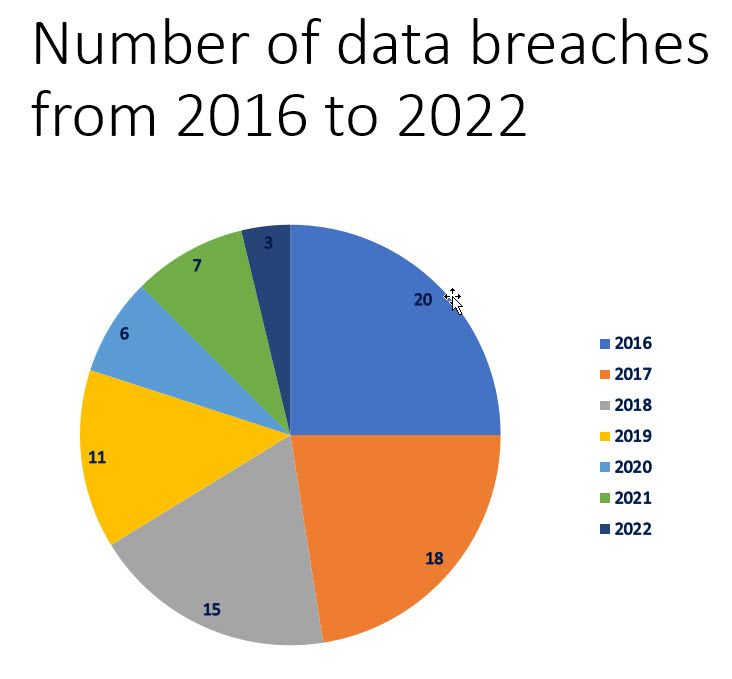
1. Which of the following graphs represents the data more accurately? Why?
graph a
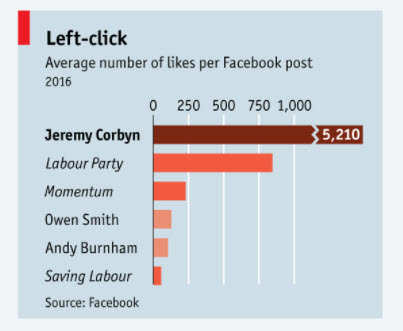
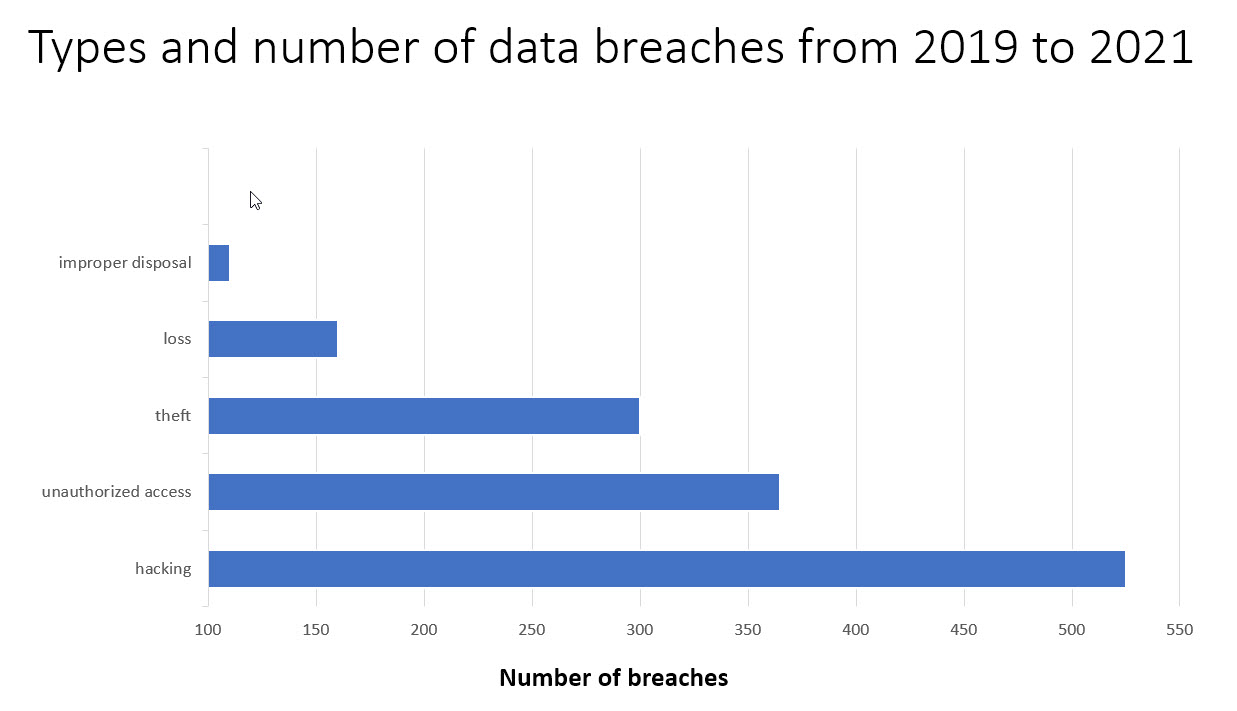
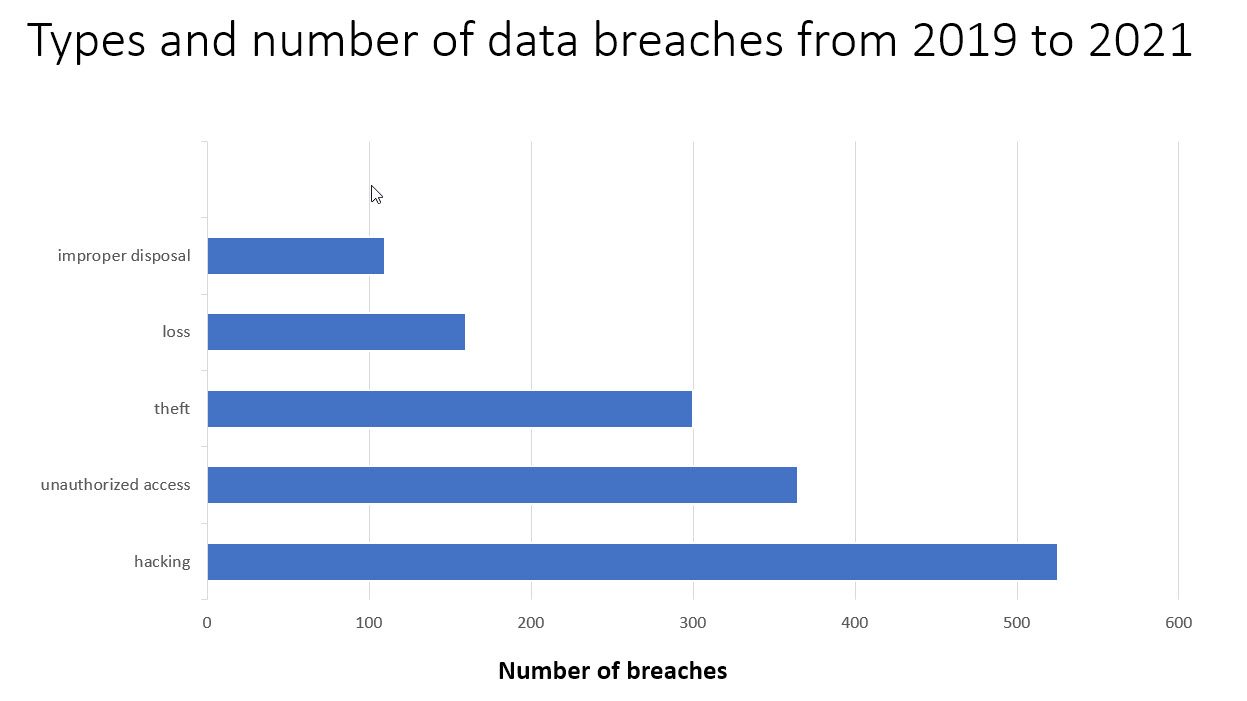
Left-click Average number of likes per Facebook post 2016 0 250 500 750 1,000 Jeremy Corbyn 5,210 Labour Party Momentum Owen Smith Andy Burnham Saving Labour Source: FacebookTypes and number of data breaches from 2019 to 2021 improper disposal loss theft unauthorized access hacking 100 150 200 250 300 350 400 450 500 550 Number of breachesTypes and number of data breaches from 2019 to 2021 improper disposal loss theft unauthorized access hacking 0 100 200 300 400 500 600 Number of breaches
Step by Step Solution
There are 3 Steps involved in it

Get step-by-step solutions from verified subject matter experts