

Question: Part I. In technical communication, data is often represented visually, perhaps through the use of graphs, tables, or charts. This discussion topic is designed to
Part I.
In technical communication, data is often represented visually, perhaps through the use of graphs, tables, or charts. This discussion topic is designed to give you practice in identifying flaws in data visualization.
In completing this discussion topic, you will first want to peruse the three resources in the section titled Visualization of Data in Learning Resources for week 7.
For each of the following four questions, please write a couple of sentences for your answer.
1. Which of the following graphs represents the data more accurately? Why?
2. Which of the following graphs represents the data more accurately? Why?
3. The following graph is deceiving. Why is it deceiving, and how would you improve it?
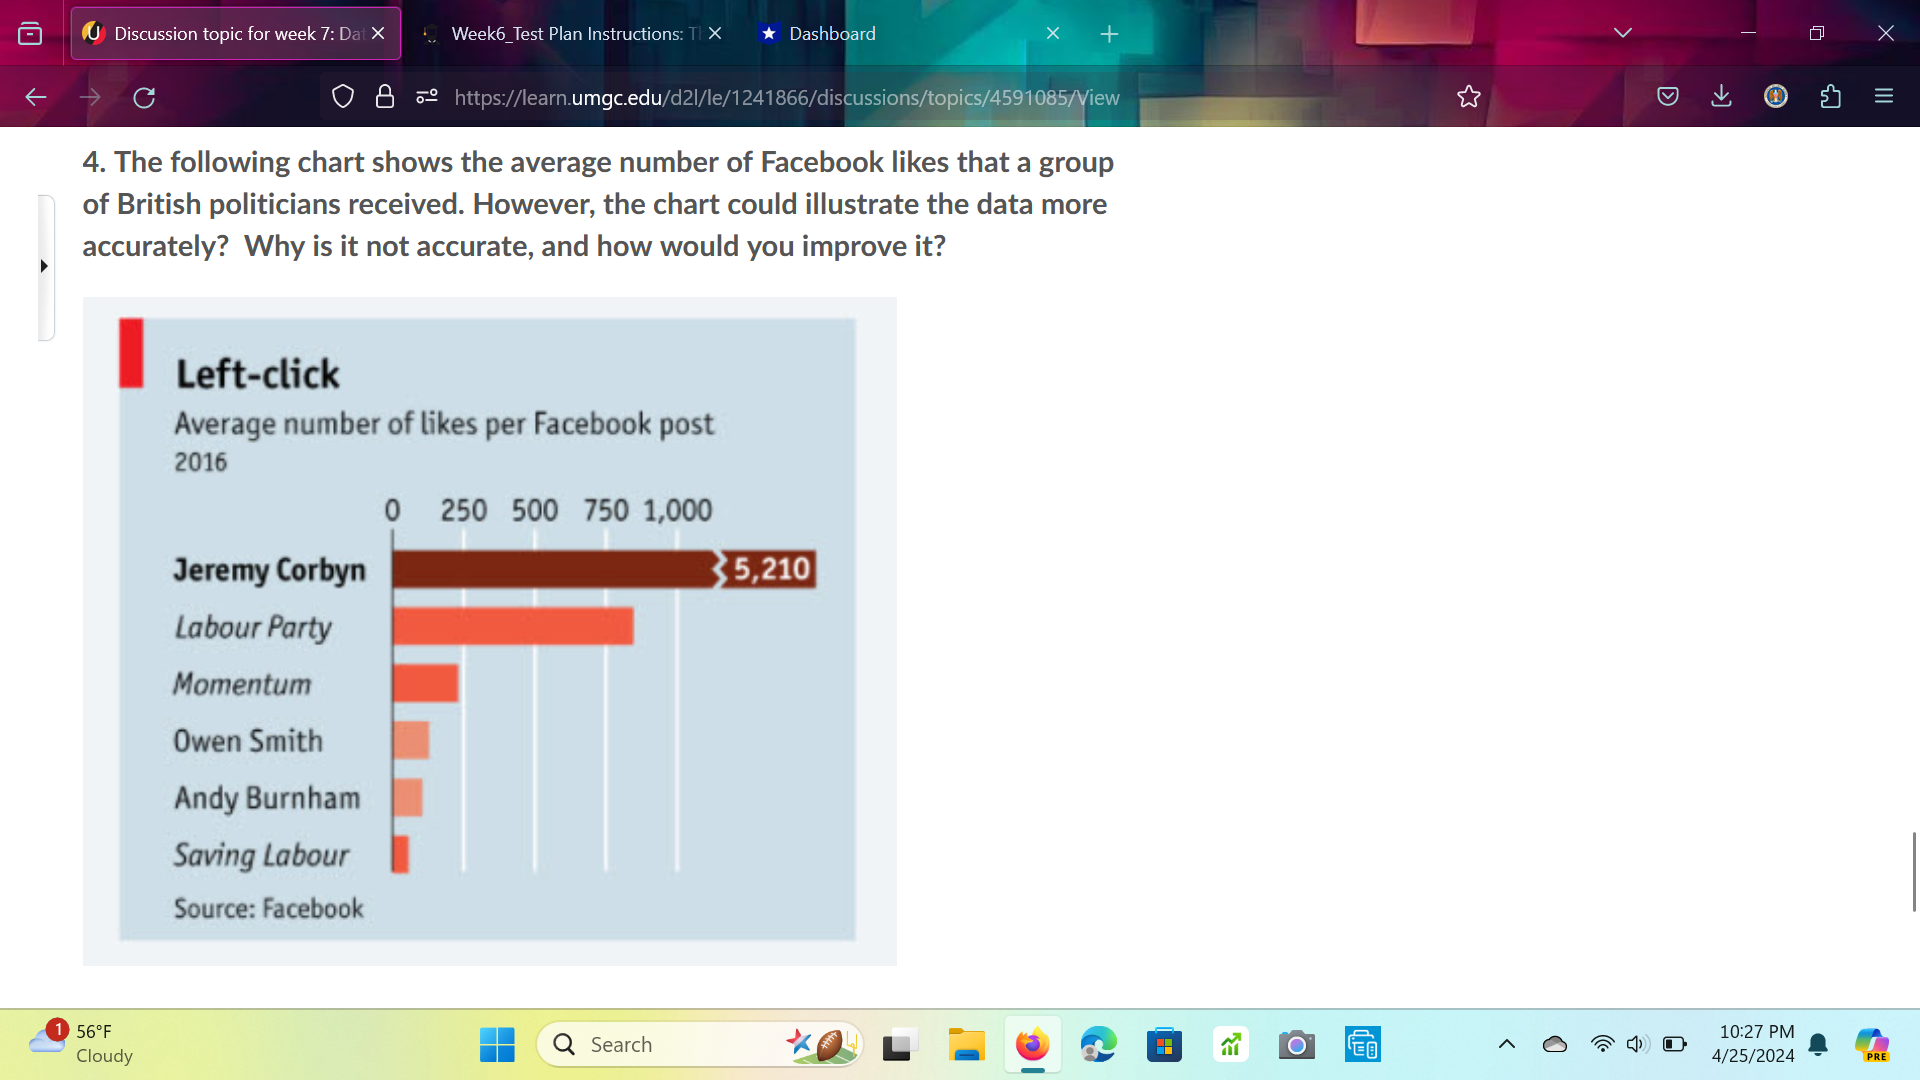
4. The following chart shows the average number of Facebook likes that a group of British politicians received. However, the chart could illustrate the data more accurately? Why is it not accurate, and how would you improve it?
Please see all the images below. Thank you

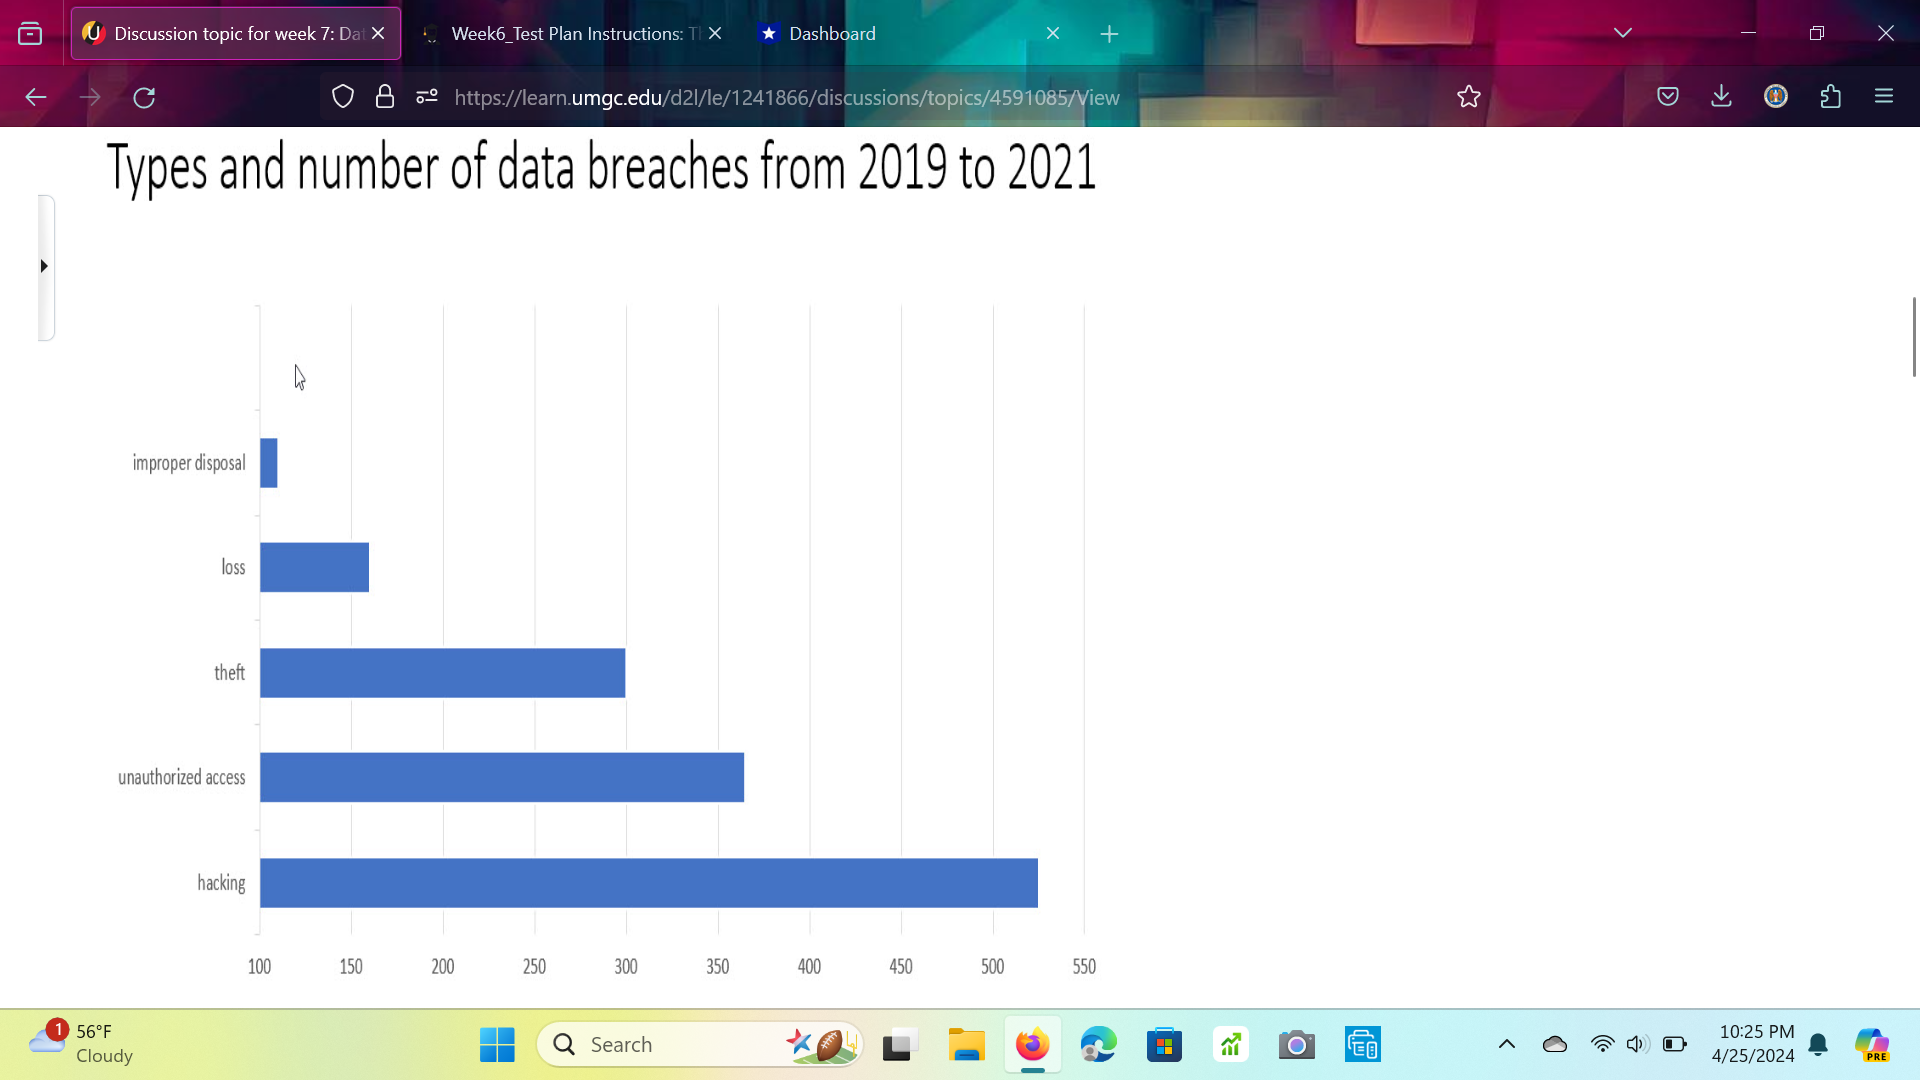
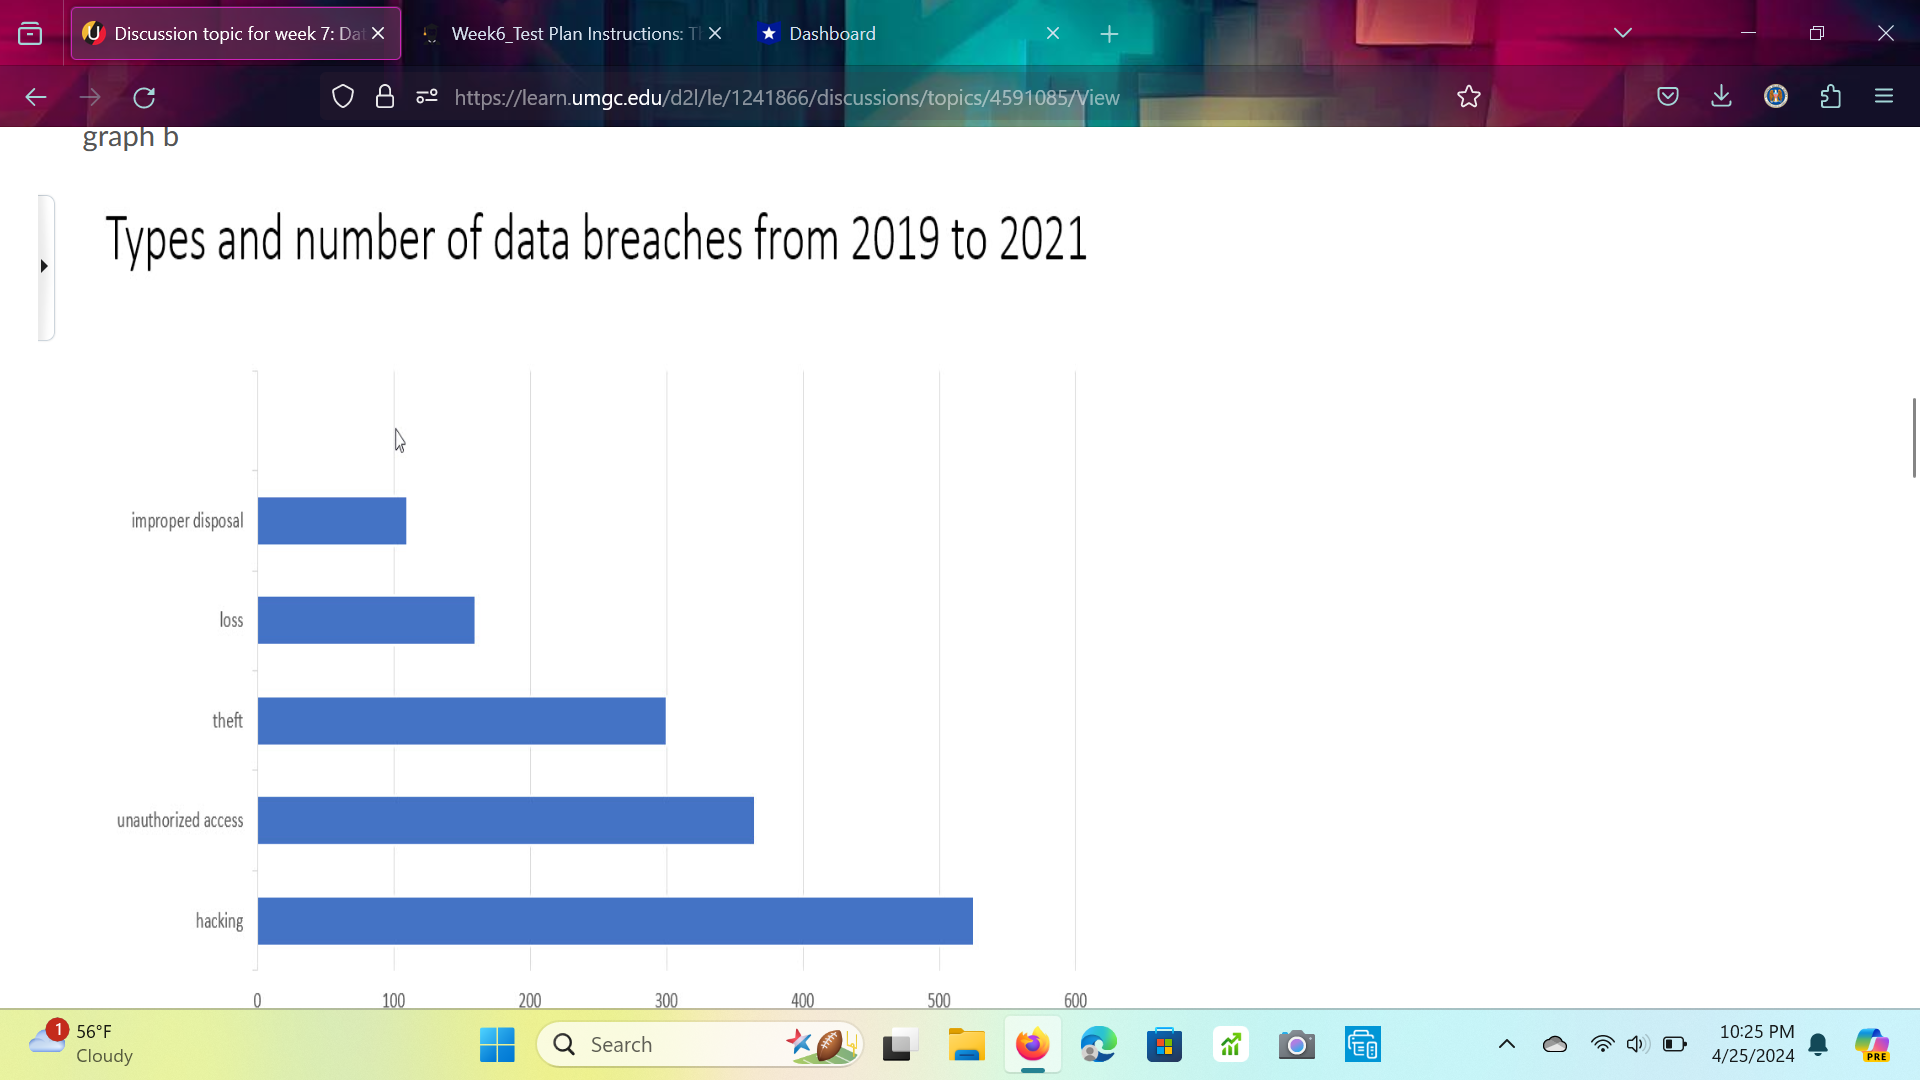
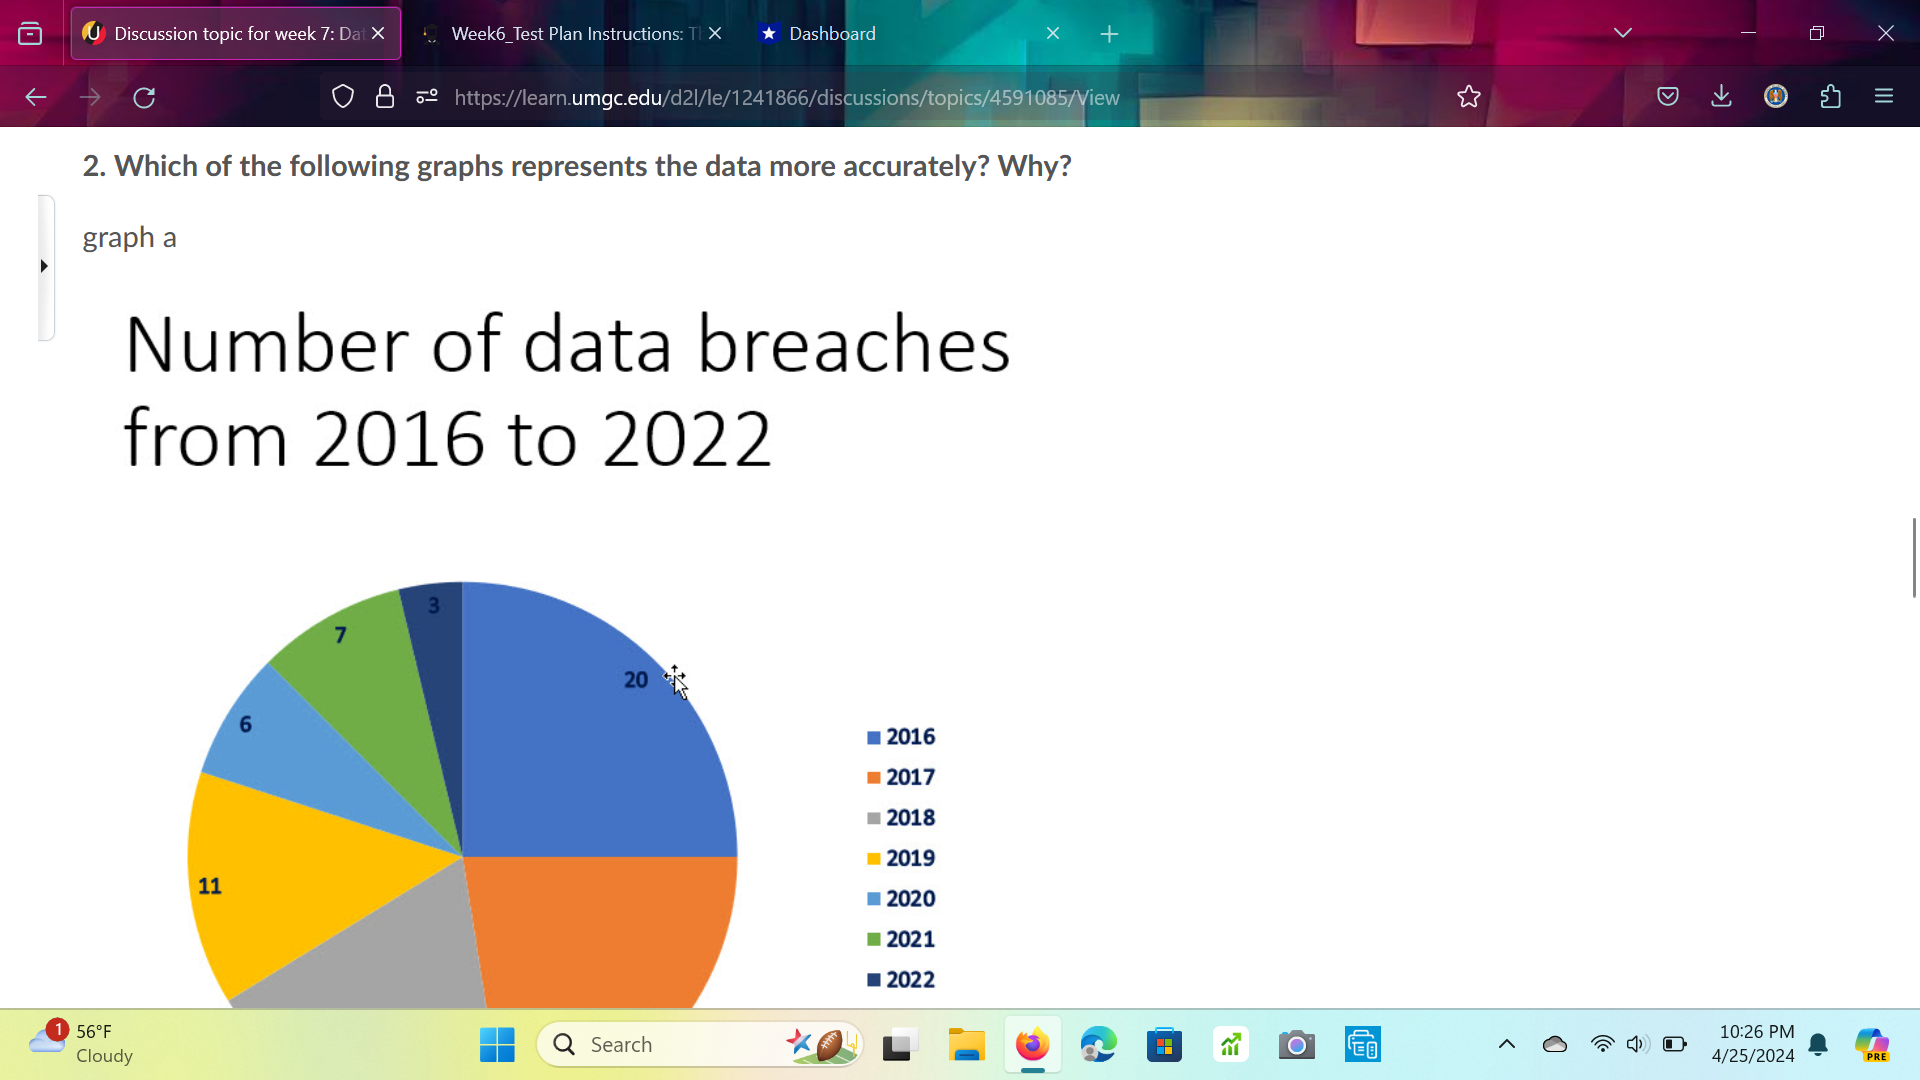
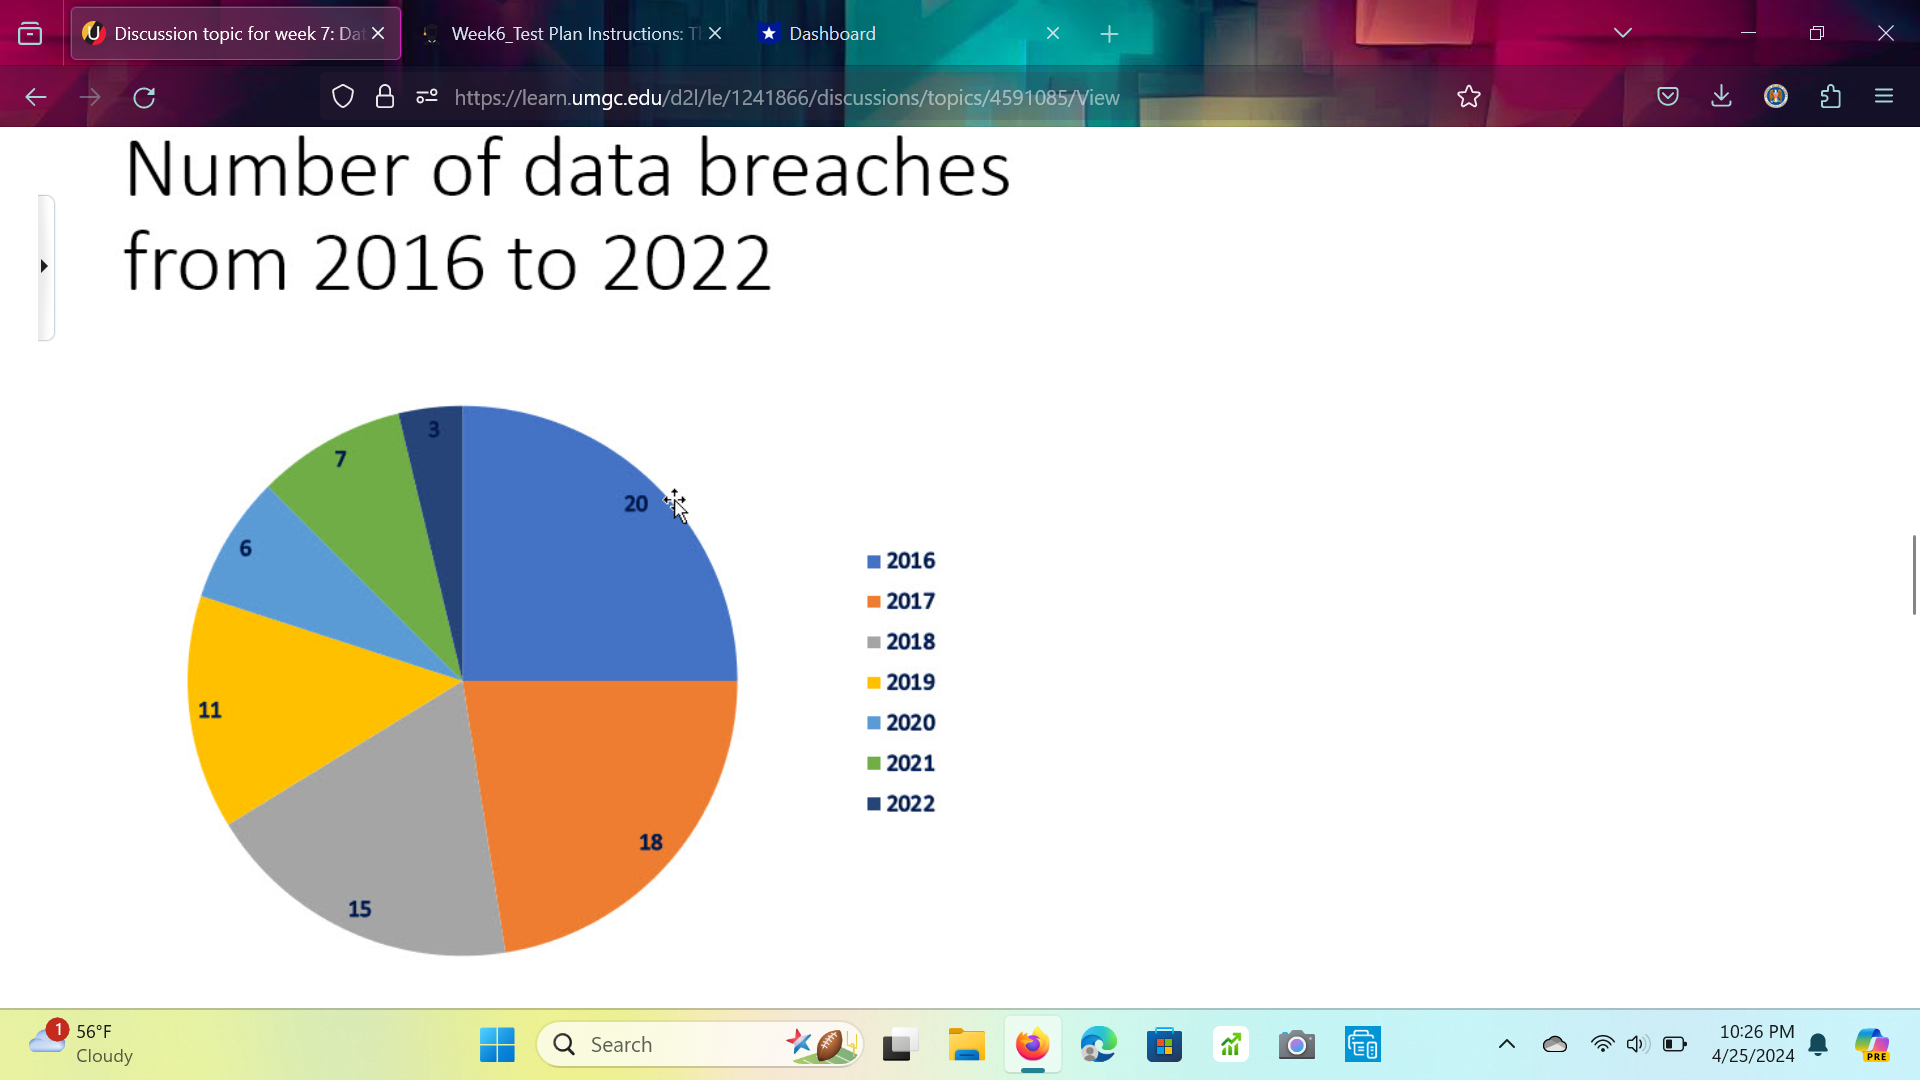
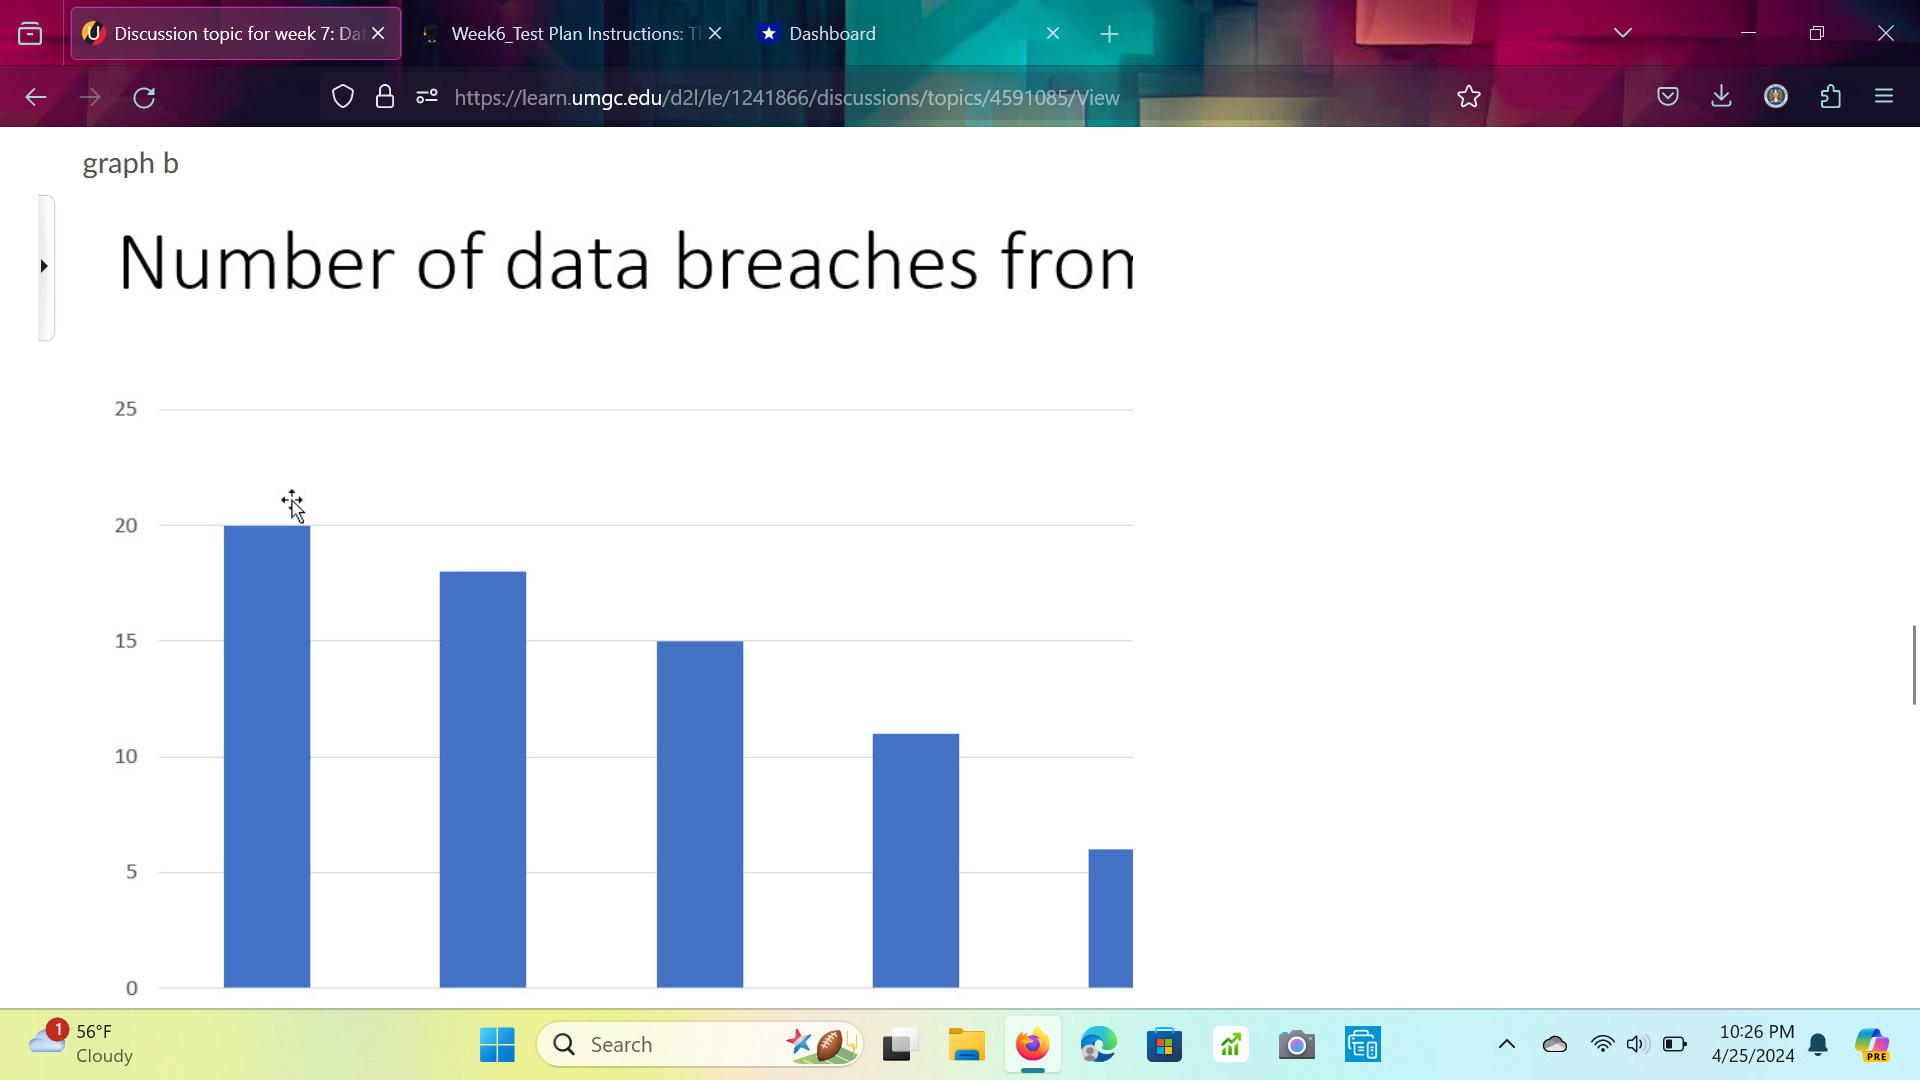
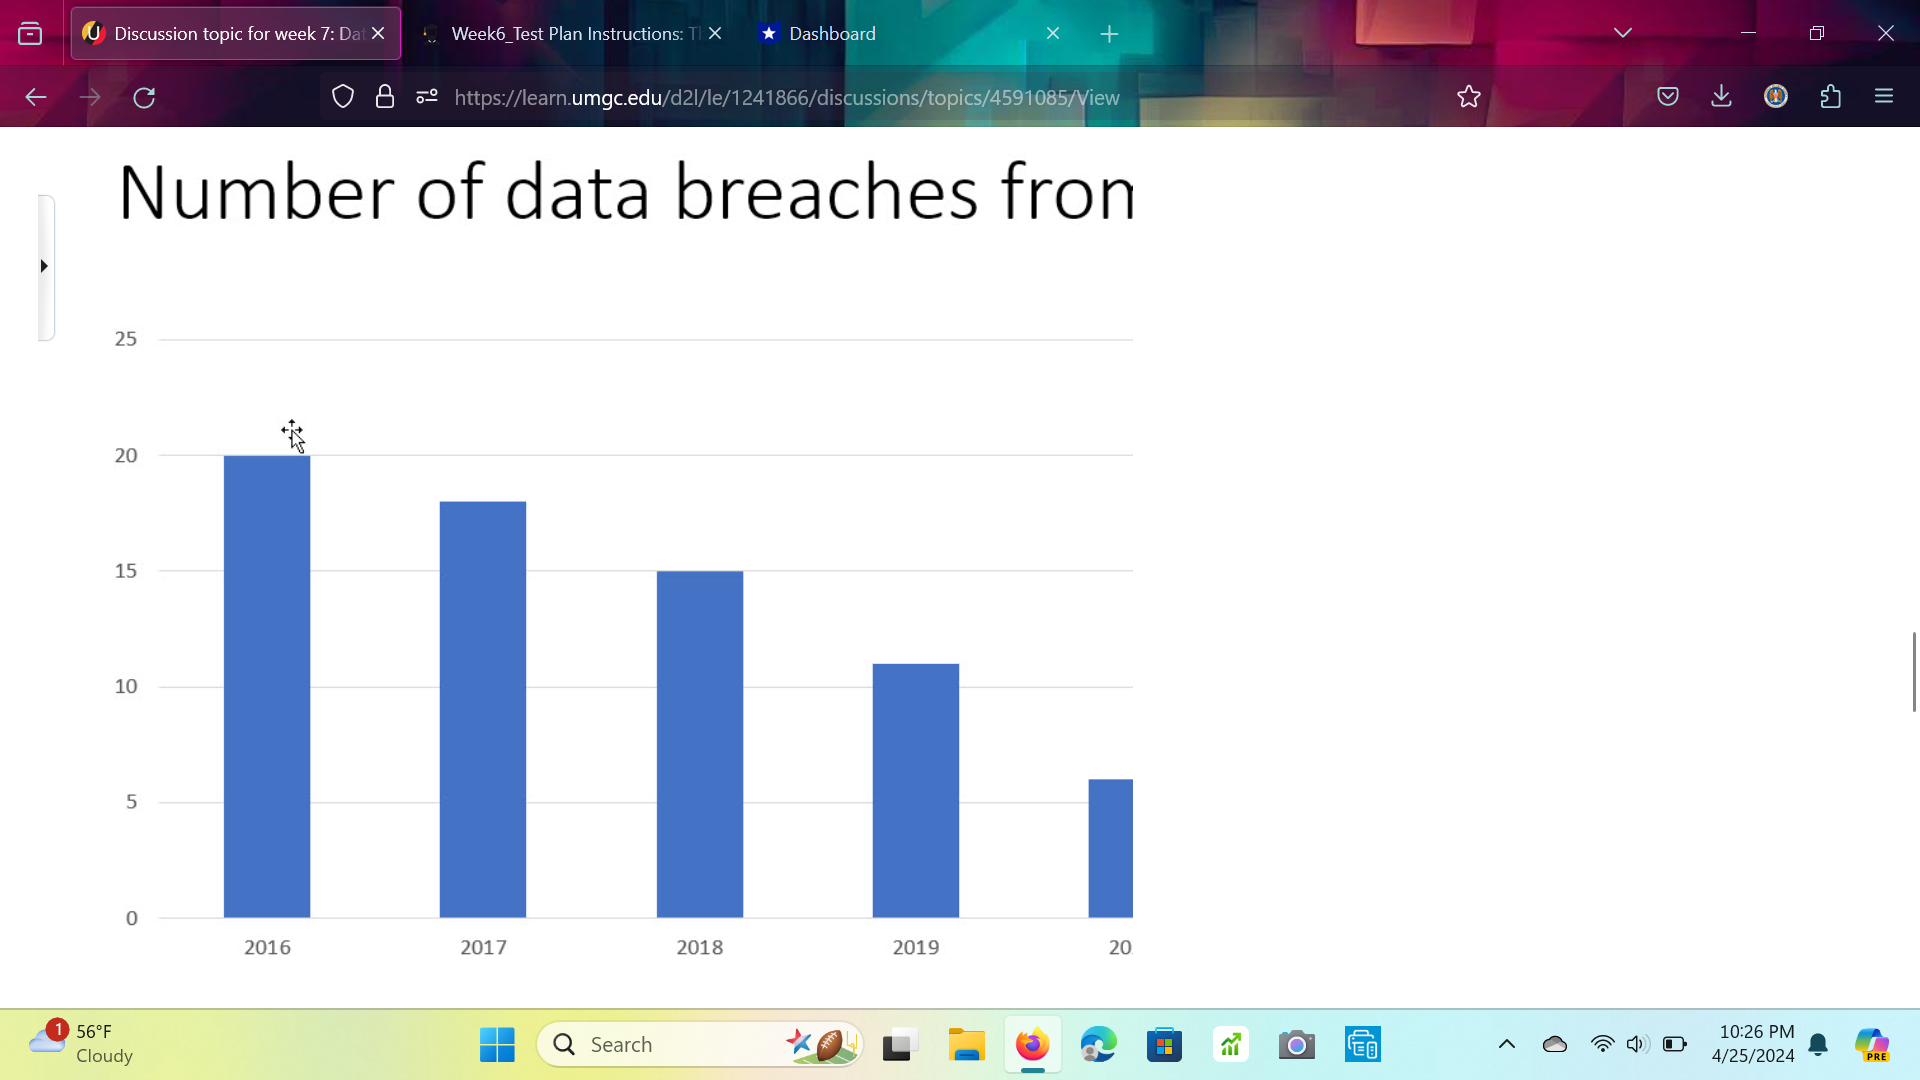
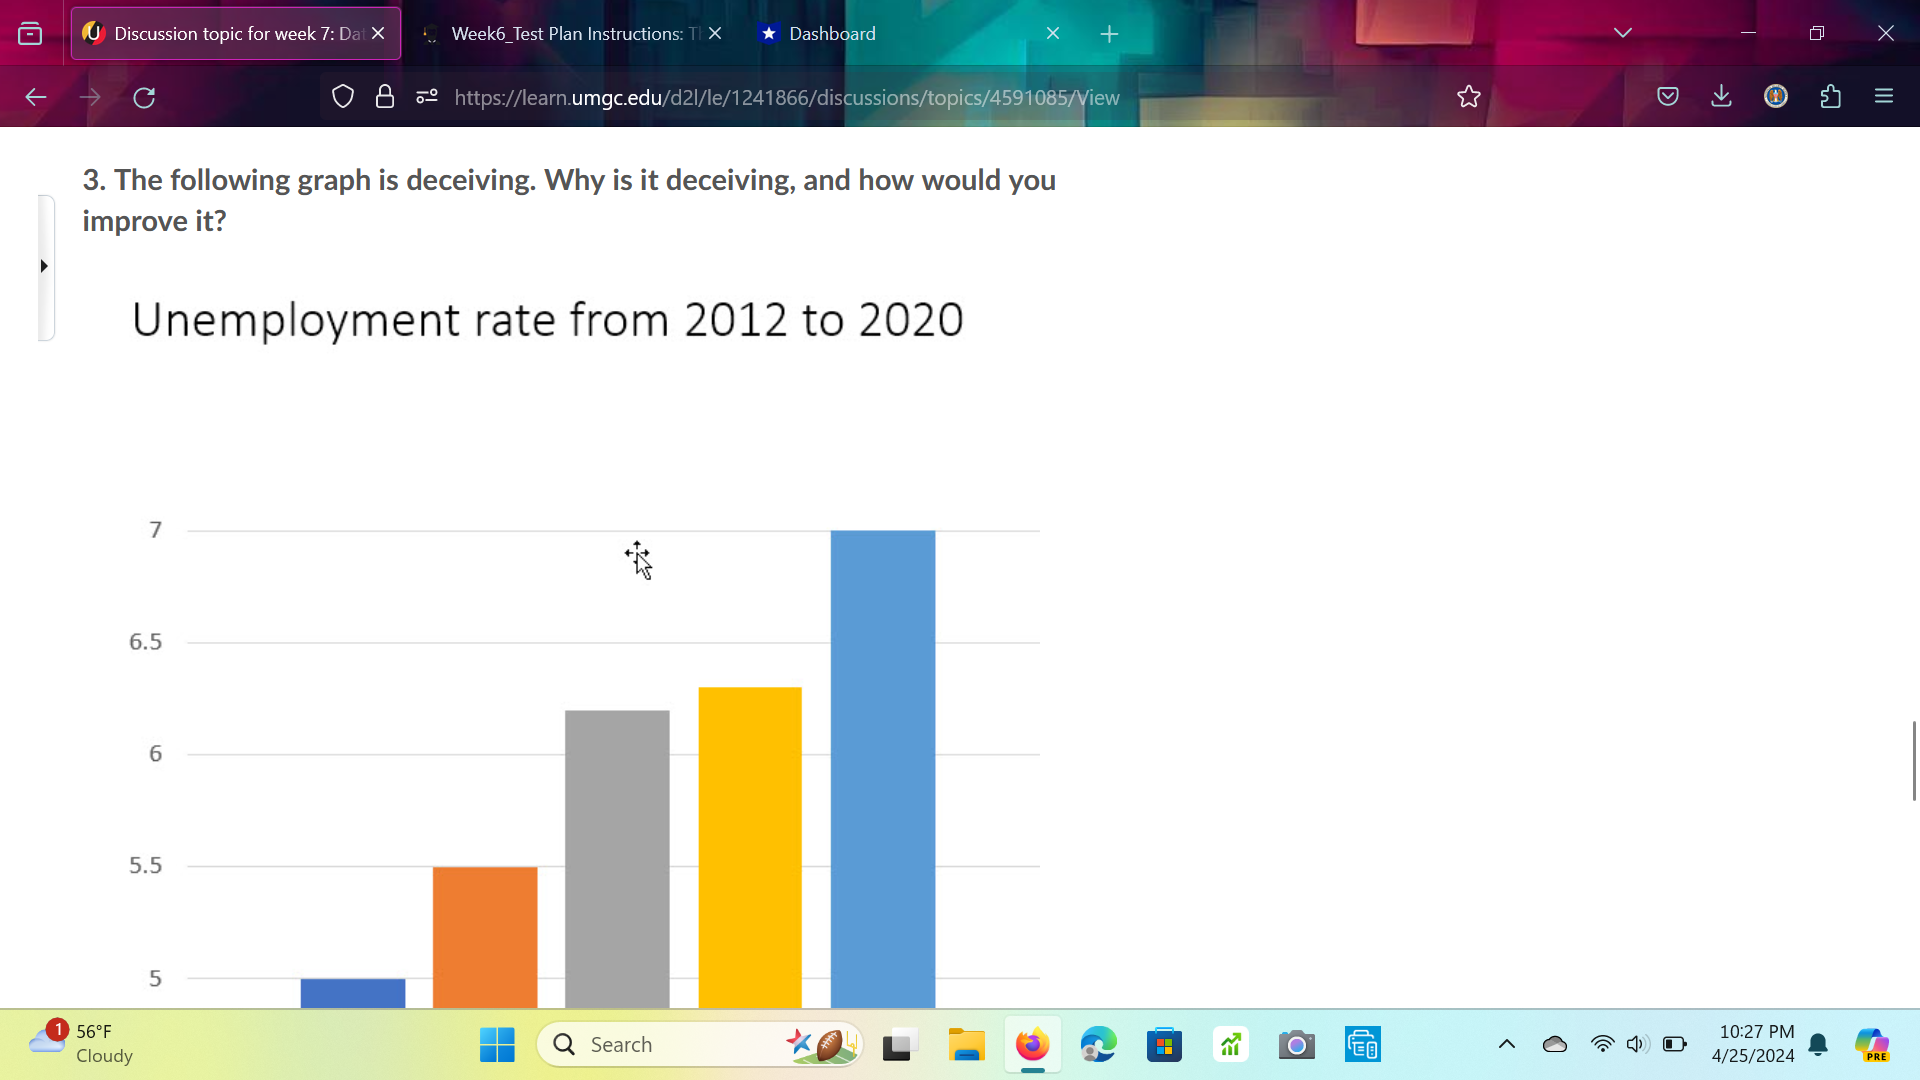
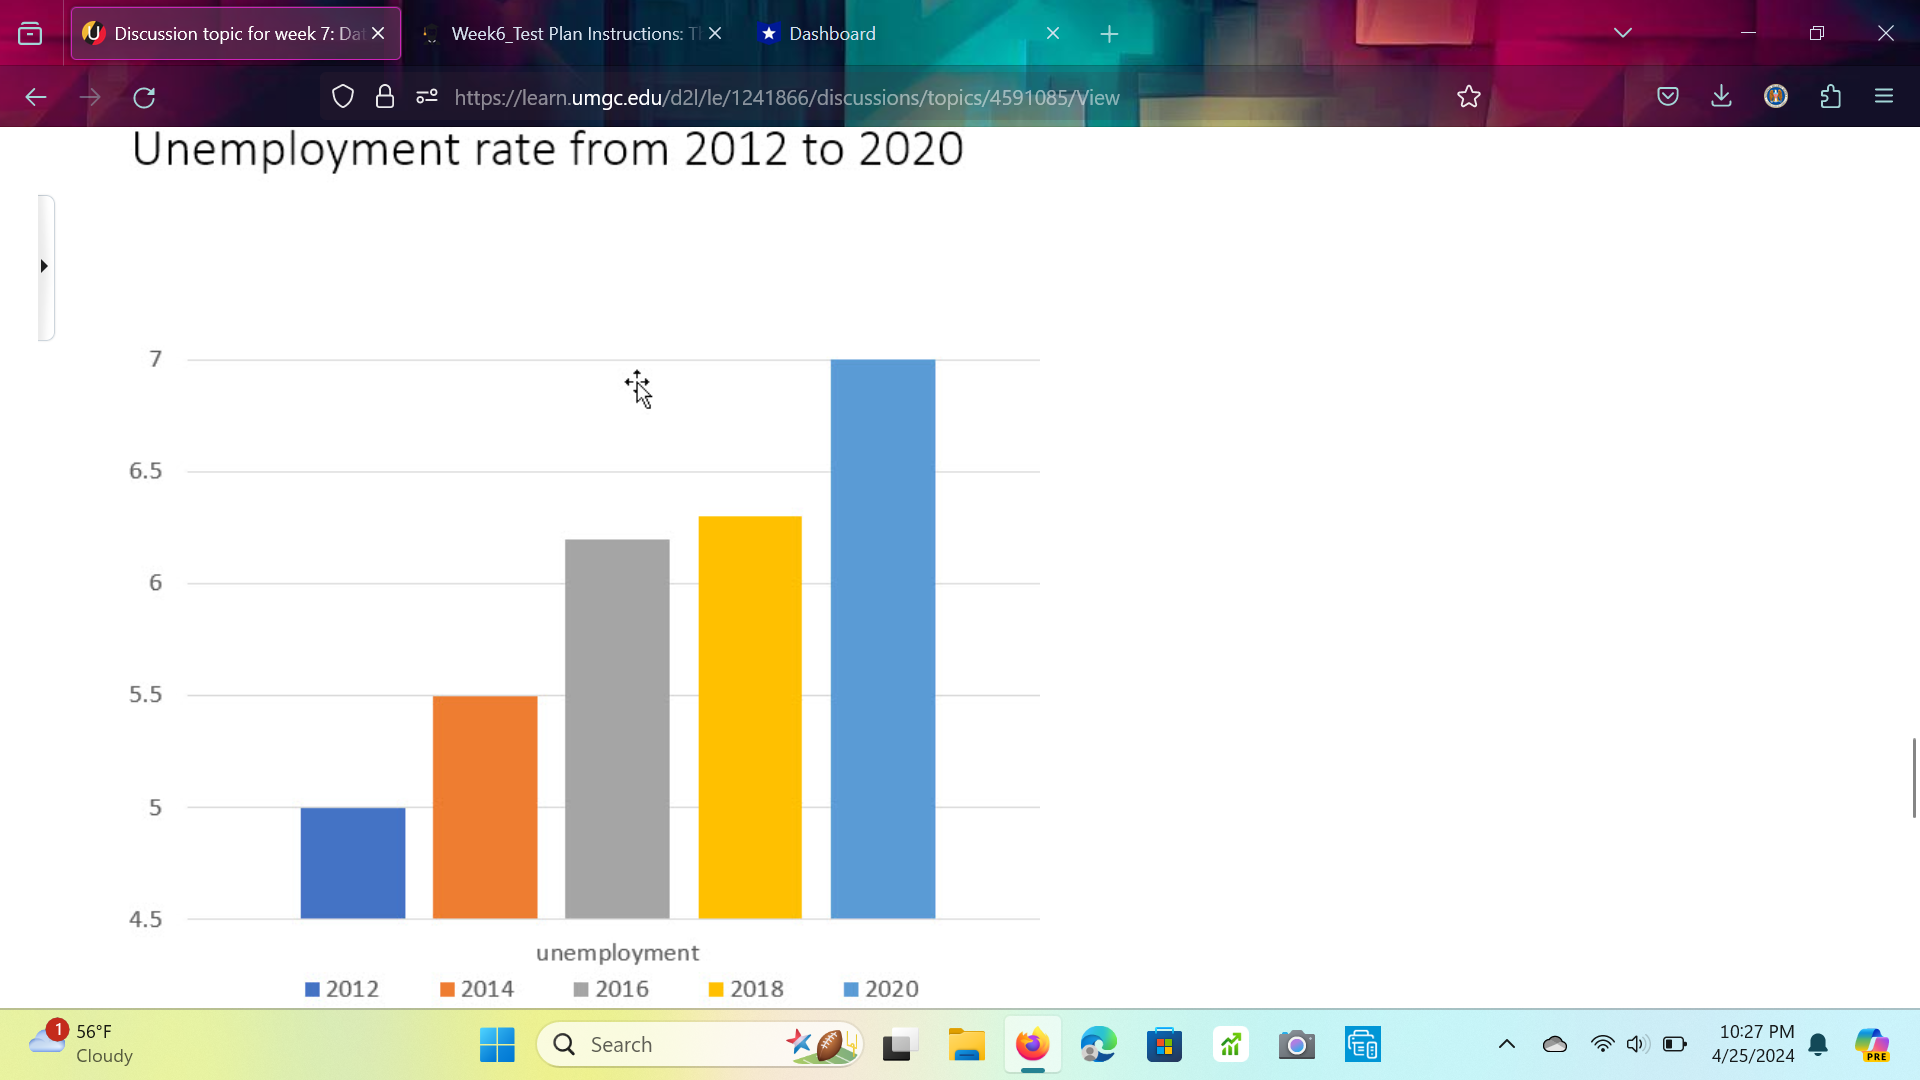
LT oI TRV A BERD 4 '. Week6_Test Plan Instructions: 1' X * Dashboard X R e O 4 = umgc.edu, cussions/topics/4591085/Yiew In technical communication, data is often represented visually, perhaps through the use of graphs, tables, or charts. This discussion topic is designed to give you practice in identifying flaws in data visualization. In completing this discussion topic, you will first want to peruse the three resources in the section titled Visualization of Data in Learning Resources for week 7. For each of the following four questions, please write a couple of sentences for your answer. 1. Which of the following graphs represents the data more accurately? Why? graph a Types and number of data breaches from 2019 to 2021 5+ B o = 1024PM o g Cloudy I Q search 4k =2 928 7@ A~ S FTID i B U Discussion topic for week 7: Dat X Week6_Test Plan Instructions: TIX *Dashboard X C 0 8 .9 https://learn.umgc.edu/d21/le/1241866/discussions/topics/4591085/View CLOSE Types and number of data breaches from 2019 to 2021 improper disposal loss theft unauthorized access hacking 100 150 200 250 300 350 400 450 500 550 1 56.F 10:25 PM Q Search O 4/25/2024 CloudyG U Discussion topic for week 7: Dat X Week6_Test Plan Instructions: TIX Dashboard X X C 0 8 .9 https://learn.umgc.edu/d21/le/1241866/discussions/topics/4591085/View CLOSE graph b Types and number of data breaches from 2019 to 2021 improper disposal loss theft unauthorized access hacking 0 100 200 300 400 500 600 1 56.F Cloudy Q Search 10:25 PM 3 O 4/25/2024U Discussion topic for week 7: Dat X Week6_Test Plan Instructions: TIX Dashboard X X C 0 8 . https://learn.umgc.edu/d21/le/1241866/discussions/topics/4591085/View CLOSE 2. Which of the following graphs represents the data more accurately? Why? graph a Number of data breaches from 2016 to 2022 20 6 2016 2017 2018 2019 11 2020 2021 2022 1 56.F Cloudy Q Search O 10:26 PM 4/25/2024U Discussion topic for week 7: Dat X Week6_Test Plan Instructions: TIX Dashboard X C 0 8 69 https://learn.umgc.edu/d21/le/1241866/discussions/topics/4591085/View CLOSE Number of data breaches from 2016 to 2022 20 6 2016 2017 2018 2019 11 2020 2021 2022 18 15 1 56.F Q Search 10:26 PM Cloudy O 4/25/2024G U Discussion topic for week 7: Dat X Week6_Test Plan Instructions: TIX Dashboard X X C 0 8 .9 https://learn.umgc.edu/d21/le/1241866/discussions/topics/4591085/View CLOSE graph b Number of data breaches fron 25 20 15 10 5 0 1 56.F Cloudy Q Search WOULD O O 10:26 PM 4/25/2024U Discussion topic for week 7: Dat X Week6_Test Plan Instructions: TIX Dashboard X C O 8 69 https://learn.umgc.edu/d21/le/1241866/discussions/topics/4591085/View CLOSE Number of data breaches fron 25 20 15 10 5 2016 2017 2018 2019 20 1 56.F Cloudy Q Search 10:26 PM O EB 4/25/2024U Discussion topic for week 7: Dat X Week6_Test Plan Instructions: TIX Dashboard X X C 0 8 : https://learn.umgc.edu/d21/le/1241866/discussions/topics/4591085/View CLOSE 3. The following graph is deceiving. Why is it deceiving, and how would you improve it? Unemployment rate from 2012 to 2020 7 6.5 6 5.5 5 1 56.F 10:27 PM Cloudy Q Search O 4/25/2024U Discussion topic for week 7: Dat X Week6_Test Plan Instructions: TIX Dashboard X C 0 8 . https://learn.umgc.edu/d21/le/1241866/discussions/topics/4591085/View CLOSE Unemployment rate from 2012 to 2020 7 6.5 6 5.5 5 4.5 unemployment 2012 2014 2016 2018 2020 1 56.F 10:27 PM Cloudy Q Search O 4/25/2024U Discussion topic for week 7: Dat X Week6_Test Plan Instructions: TIX Dashboard X - C 0 8 .: https://learn.umgc.edu/d21/le/1241866/discussions/topics/4591085/View CLOSE 4. The following chart shows the average number of Facebook likes that a group of British politicians received. However, the chart could illustrate the data more accurately? Why is it not accurate, and how would you improve it? Left-click Average number of likes per Facebook post 2016 0 250 500 750 1,000 Jeremy Corbyn 5,210 Labour Party Momentum Owen Smith Andy Burnham Saving Labour Source: Facebook 1 56.F Q Search 10:27 PM Cloudy O 4/25/2024
Step by Step Solution
There are 3 Steps involved in it

Get step-by-step solutions from verified subject matter experts