

Question: In the experimental setup in the figure, one-dimensional diffusion is aimed based on time (t) and x (cm) variables. The saturated glucose solution (red) diffuses
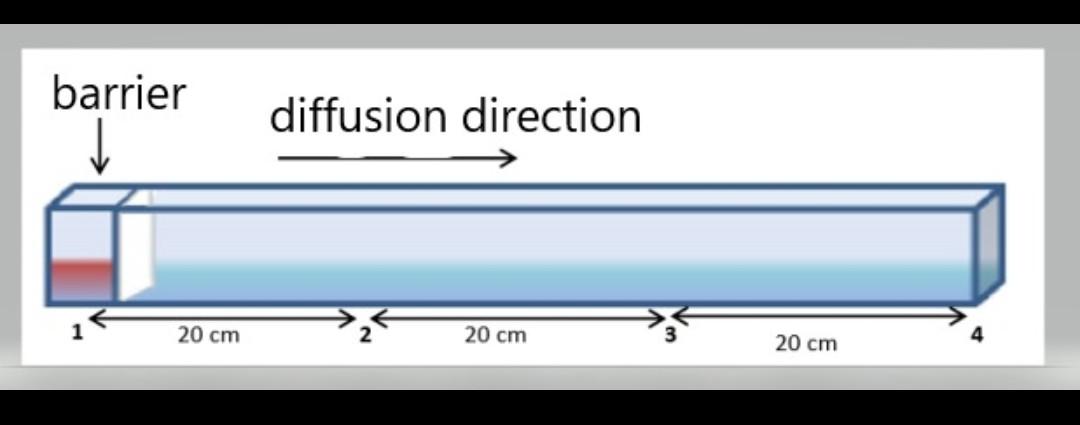
In the experimental setup in the figure, one-dimensional diffusion is aimed based on time (t) and x (cm) variables. The saturated glucose solution (red) diffuses into the liquid (water) by removing the barrier. Diffusion starts from 1 point. Dissolved saturated The concentration of the solution is 1.2 g / ml. When the diffusion reaches the midpoint (point 2) at t = 30 seconds, samples are taken from 1 and 2 points (x = 20). The concentrations of these samples are 1 g / ml and 0.1 g / ml, respectively. When the diffusion reaches the end of the system (point 3) at t = 75 sec, samples are taken from 1 and 3 points. The concentrations of these samples are 0.6 g / ml and 0.03 g / ml, respectively. a) Calculate the experimental diffusion coefficient using the values given for two different t times. For this, you can use the following Error Function Values table. b) Calculate the percentage of error since it is known that the theoretical diffusion coefficient is 6.4 cm2 / sec using the Wilke-Chang equation.
barrier diffusion direction 1 20 cm 20 cm 20 cm
Step by Step Solution
There are 3 Steps involved in it

Get step-by-step solutions from verified subject matter experts