

Question: In the graph at right are data that a corn farmer collected over two growing seasons. In the first season, the farmer measured the
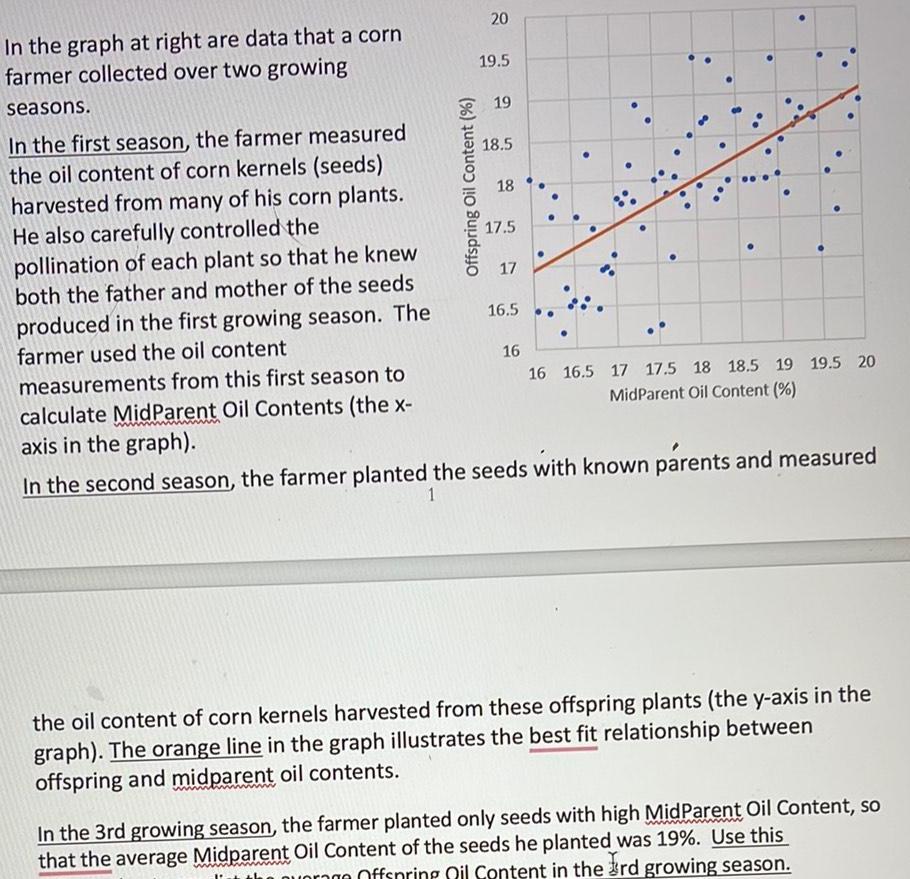
In the graph at right are data that a corn farmer collected over two growing seasons. In the first season, the farmer measured the oil content of corn kernels (seeds) harvested from many of his corn plants. He also carefully controlled the pollination of each plant so that he knew both the father and mother of the seeds produced in the first growing season. The farmer used the oil content measurements from this first season to calculate MidParent Oil Contents (the x- axis in the graph). Offspring Oil Content (%) 20 20 19.5 19 19 18.5 18 17.5 17 16.5 16 16 16.5 17 17.5 18 18.5 19 19.5 20 MidParent Oil Content (%) In the second season, the farmer planted the seeds with known parents and measured 1 the oil content of corn kernels harvested from these offspring plants (the y-axis in the graph). The orange line in the graph illustrates the best fit relationship between offspring and midparent oil contents. www In the 3rd growing season, the farmer planted only seeds with high MidParent Oil Content, so that the average Midparent Oil Content of the seeds he planted was 19%. Use this Offspring Oil Content in the 3rd growing season.
Step by Step Solution
There are 3 Steps involved in it

Get step-by-step solutions from verified subject matter experts