

Question: In the Java App:Black histogram: Population distribution (Distribution of time it takes for the PSU students to come to campus)Blue histogram: Sampling distribution of LaTeX:
In the Java App:Black histogram: Population distribution (Distribution of time it takes for the PSU students to come to campus)Blue histogram: Sampling distribution of LaTeX: \overline{X}
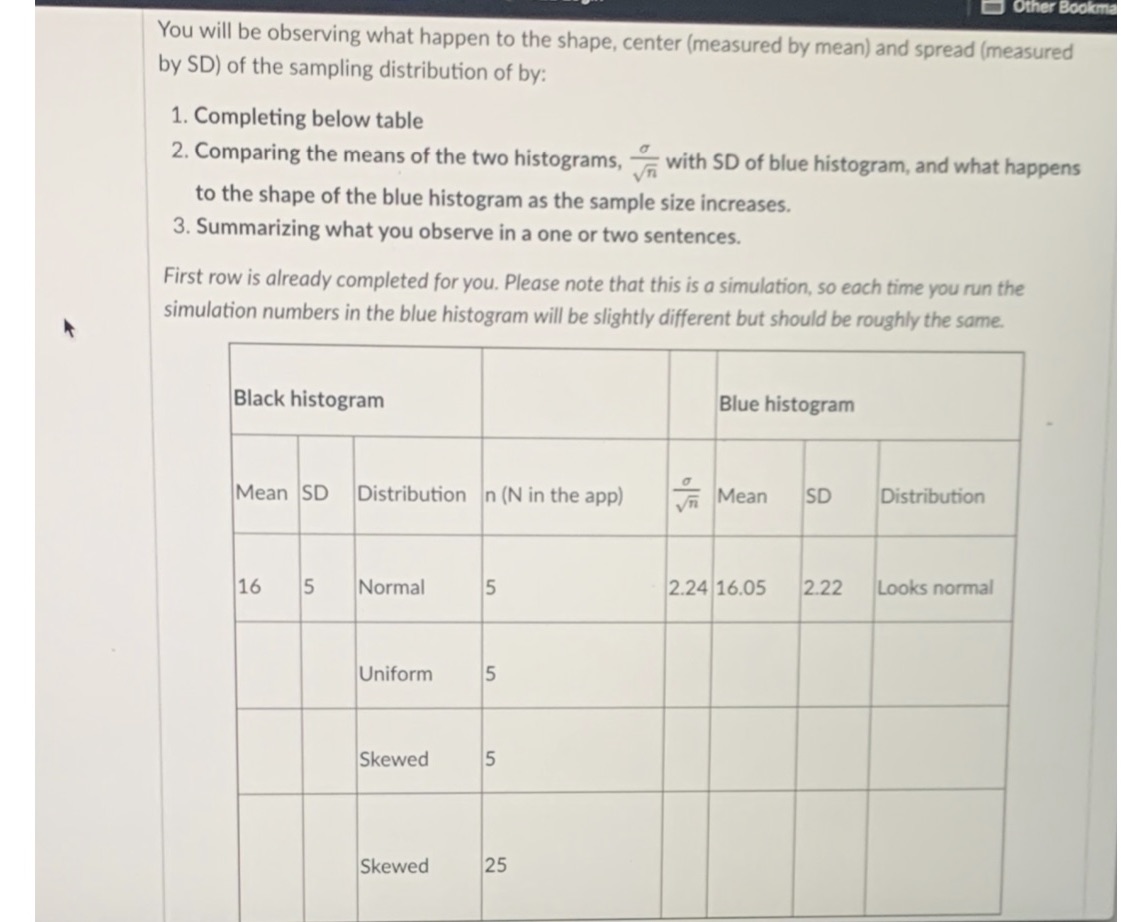
You will be observing what happen to the shape, center (measured by mean) and spread (measured by SD) of the sampling distribution of by: 1. Completing below table 2. Comparing the means of the two histograms, with SD of blue histogram, and what happens to the shape of the blue histogram as the sample size increases. 3. Summarizing what you observe in a one or two sentences. First row is already completed for you. Please note that this is a simulation, so each time you run the simulation numbers in the blue histogram will be slightly different but should be roughly the same. Black histogram Blue histogram Mean SD Distribution n (N in the app) Mean SD Distribution 16 5 Normal 5 2.24 16.05 2.22 Looks normal Uniform 5 Skewed 5 Skewed 25
Step by Step Solution
There are 3 Steps involved in it

Get step-by-step solutions from verified subject matter experts