

Question: in the project network presented below, numbers on each arrow refer to the expected time and standard deviation in weeks for that particular activity. for
in the project network presented below, numbers on each arrow refer to the expected time and standard deviation in weeks for that particular activity. for example, "8,2" indicates an activity with an expected time of 8 and a standard deviation of two weeks. 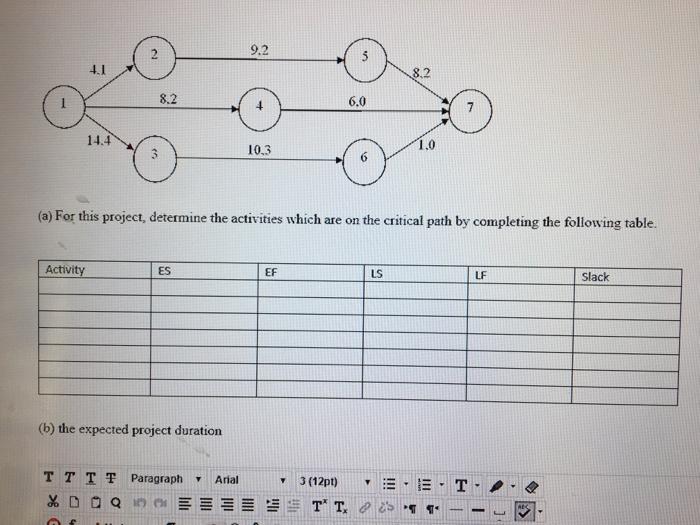
Step by Step Solution
There are 3 Steps involved in it
1 Expert Approved Answer
Step: 1 Unlock

Question Has Been Solved by an Expert!
Get step-by-step solutions from verified subject matter experts
Step: 2 Unlock
Step: 3 Unlock