

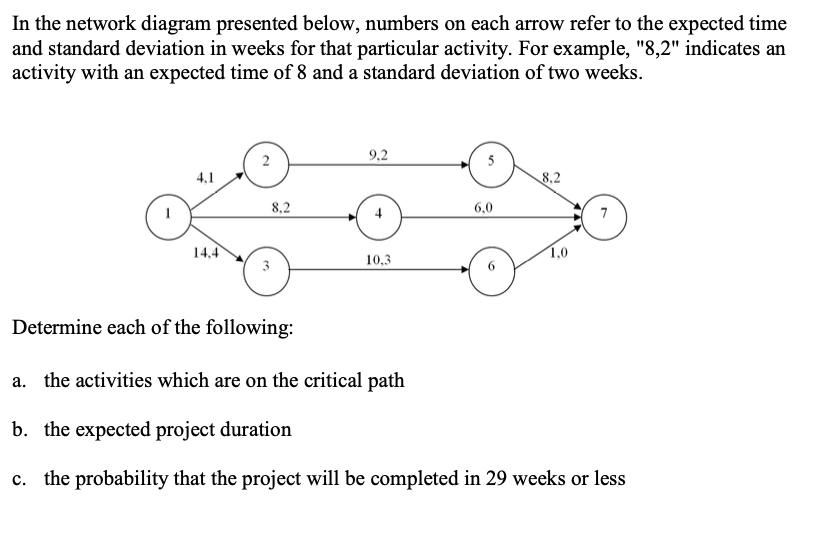
Question: In the network diagram presented below, numbers on each arrow refer to the expected time and standard deviation in weeks for that particular activity. For
Step by Step Solution
There are 3 Steps involved in it
1 Expert Approved Answer
Step: 1 Unlock

Question Has Been Solved by an Expert!
Get step-by-step solutions from verified subject matter experts
Step: 2 Unlock
Step: 3 Unlock