

Question: In the R program 1.- Run the following code data(ArPassangers) df e- ArPassengers df Que salida produce el codigo? 2.- How do you interpret the
In the R program
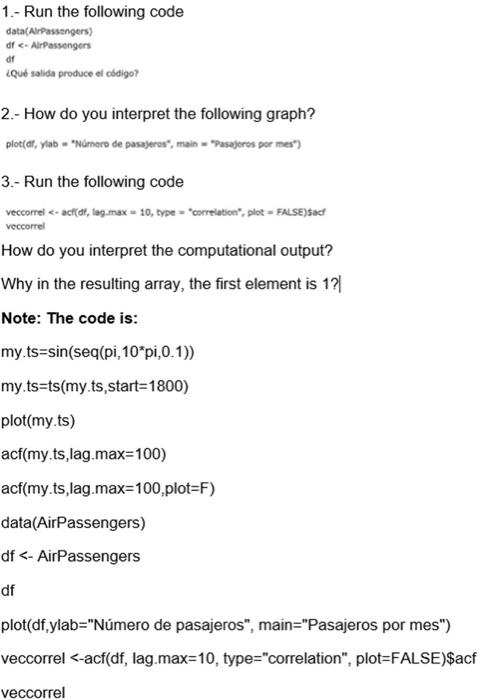
1.- Run the following code data(ArPassangers) df e- ArPassengers df Que salida produce el codigo? 2.- How do you interpret the following graph? plot(de, yab = "Nmoro de pasajeres", main = "Pasajeros por mes") 3.- Run the following code veccorrel =sin(seq( pi, 10 pi, 0.1)) my.ts = ts ( my.ts, start =1800) plot(my.ts) acf(my.ts,lag.max=100) acf(myts,lag.max =100, plot =F) data(AirPassengers) df
Step by Step Solution
There are 3 Steps involved in it
1 Expert Approved Answer
Step: 1 Unlock

Question Has Been Solved by an Expert!
Get step-by-step solutions from verified subject matter experts
Step: 2 Unlock
Step: 3 Unlock