

Question: In the table below are statistics showing the working age population, the labor force and total employment in year 1 and year 2. Make the
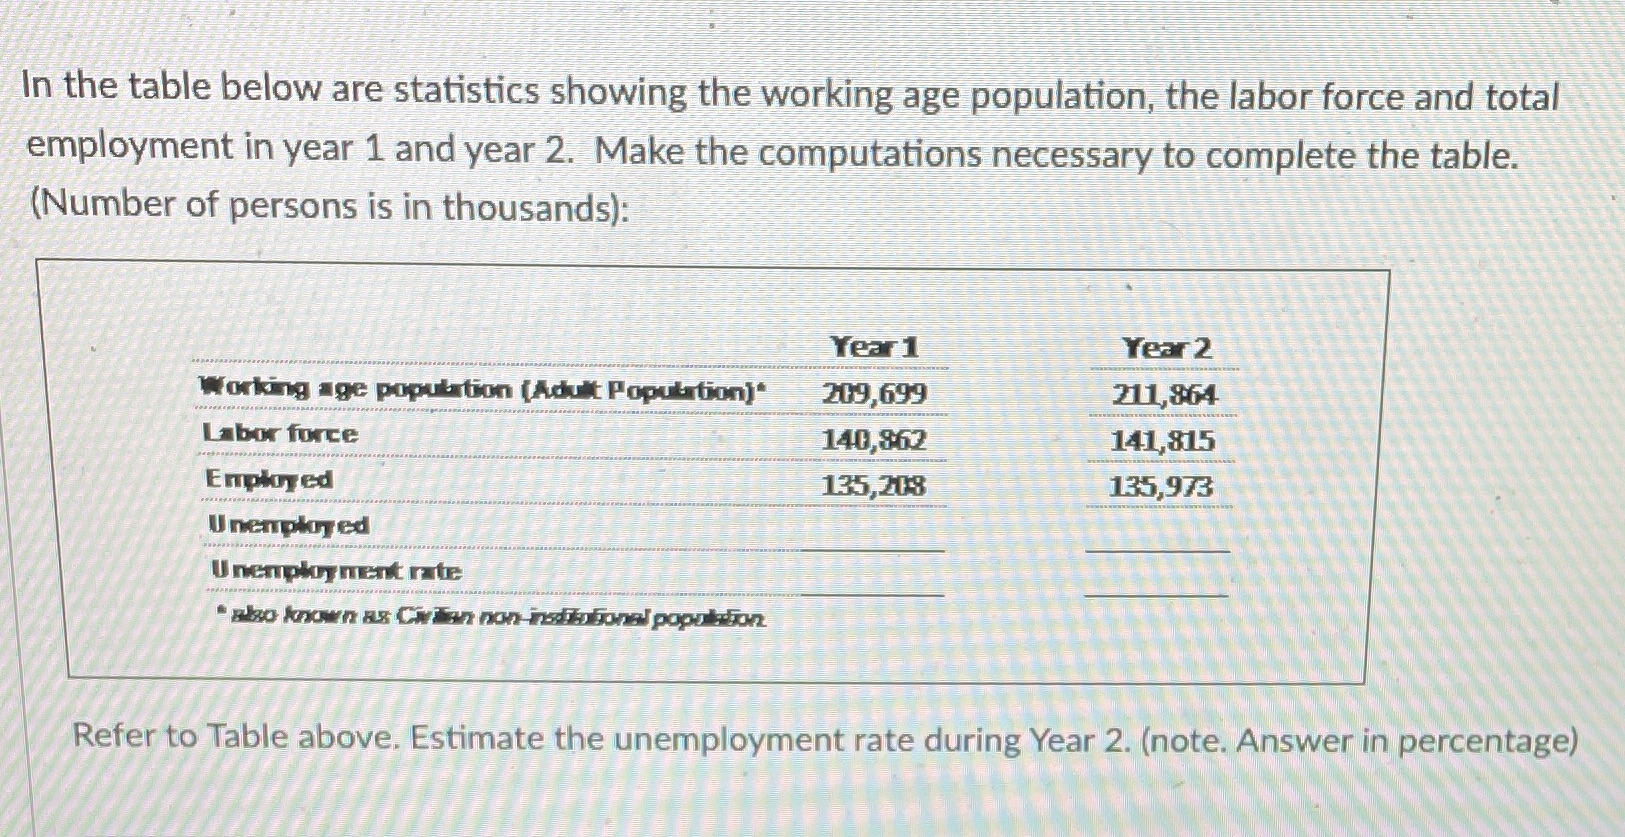
In the table below are statistics showing the working age population, the labor force and total employment in year 1 and year 2. Make the computations necessary to complete the table. (Number of persons is in thousands): Year 1 Year 2 Working age population (Adult Population]" 209,699 211,864 Labor force 140.862 141,815 Employed 135,208 135,973 Unemployed Unemployment rate sho known as CATin non radiotonal population Refer to Table above. Estimate the unemployment rate during Year 2. (note. Answer in percentage)
Step by Step Solution
There are 3 Steps involved in it
1 Expert Approved Answer
Step: 1 Unlock

Question Has Been Solved by an Expert!
Get step-by-step solutions from verified subject matter experts
Step: 2 Unlock
Step: 3 Unlock