

Question: In the table below are statistics showing the working age population, the labor force and total employment in year 1 and year 2. Make the
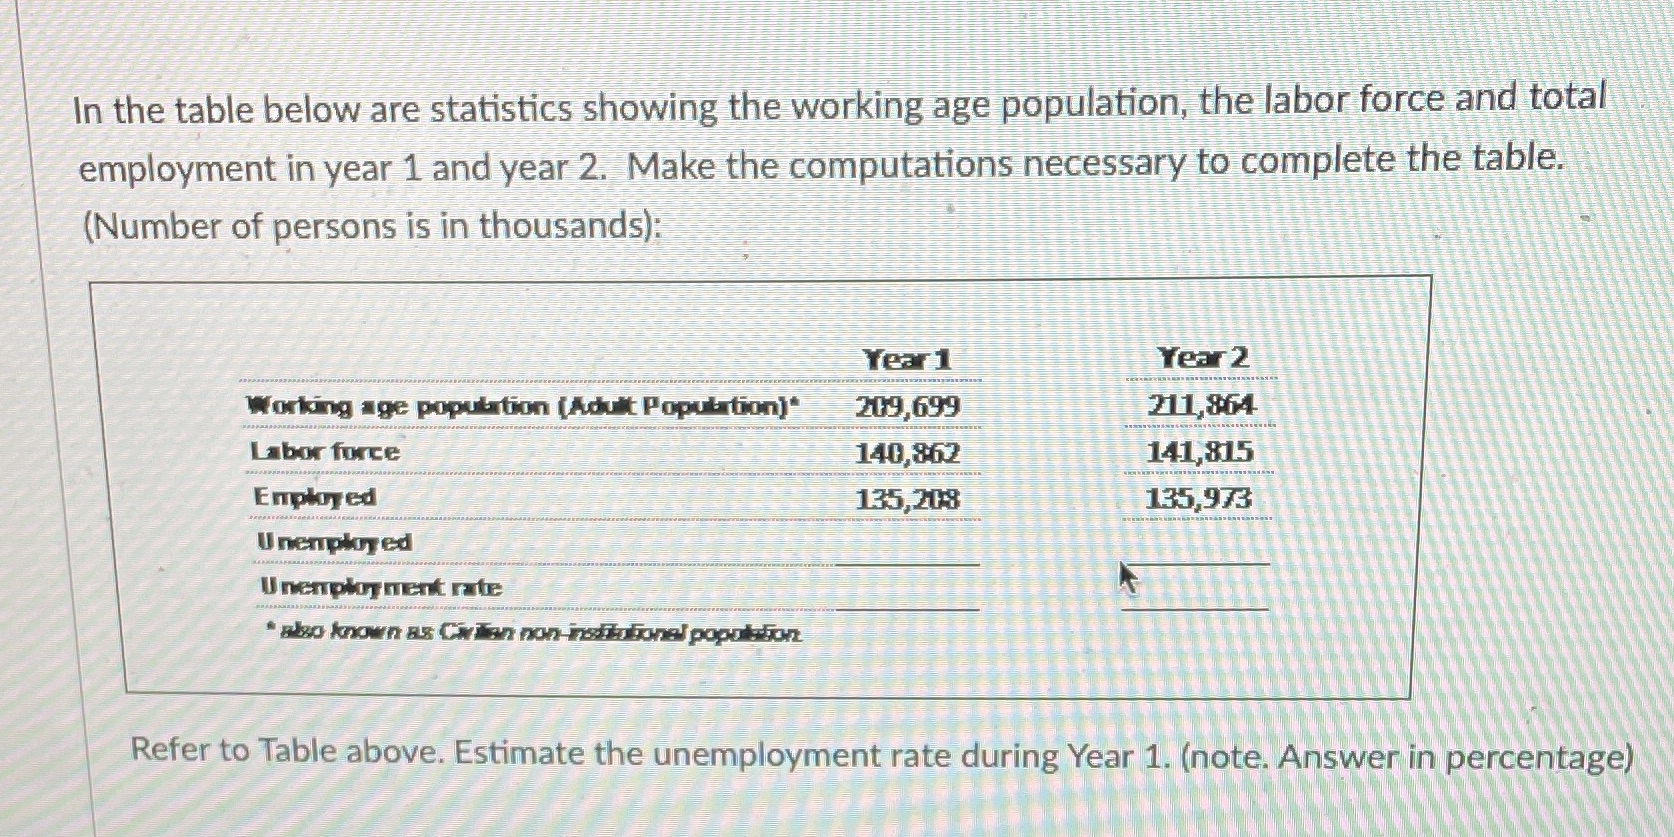
In the table below are statistics showing the working age population, the labor force and total employment in year 1 and year 2. Make the computations necessary to complete the table. (Number of persons is in thousands): Year 1 Year 2 Working age population (Adult Population]* 209,699 211,864 Labor force 140,862 141,815 Employed 135,208 135,973 Unemployed Unemployment rate *sho known as CivLian non-istolionel popolation Refer to Table above. Estimate the unemployment rate during Year 1. (note. Answer in percentage)
Step by Step Solution
There are 3 Steps involved in it
1 Expert Approved Answer
Step: 1 Unlock

Question Has Been Solved by an Expert!
Get step-by-step solutions from verified subject matter experts
Step: 2 Unlock
Step: 3 Unlock