

Question: In this assignment its asking to make a Pareto Chart but from what I was wondering how I can find the weights from the table.

In this assignment its asking to make a Pareto Chart but from what I was wondering how I can find the weights from the table. I was thinking of using the largest percentage to get the overall grade for each section in order to build a pareto.
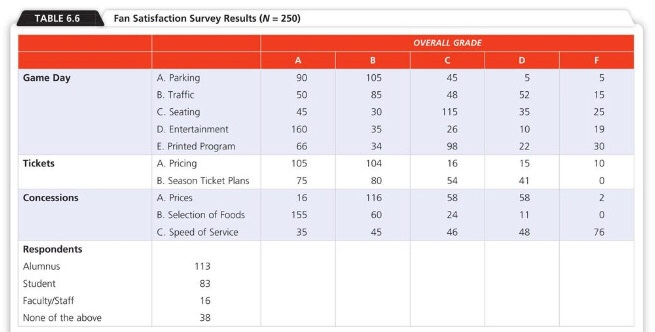
Create a Pareto Chart for the issues shown in Table 6.6 (Hint: Assign a weight to each grade to calculate an overall grade for each issue.) Which issues would you have to solve to cover 80% of the problems based on the pareto chart? TABLE 6.6 Fan Satisfaction Survey Results (N = 250) B D F Game Day 105 OVERALL GRADE 45 48 115 5 90 50 45 5 85 52 15 30 25 35 19 A. Parking B. Traffic C. Seating D. Entertainment E. Printed Program A Pricing B. Season Ticket Plans A. Prices B. Selection of Foods Speed of Service 160 66 105 75 30 26 98 16 34 104 35 10 22 15 41 Tickets 10 80 54 0 Concessions 16 116 58 58 2 155 60 24 0 11 48 35 45 46 76 113 Respondents Alumnus Student Faculty/Staff None of the above 83 16 38 Question 5, you only need to create a chart ranking the issues
Step by Step Solution
There are 3 Steps involved in it
1 Expert Approved Answer
Step: 1 Unlock

Question Has Been Solved by an Expert!
Get step-by-step solutions from verified subject matter experts
Step: 2 Unlock
Step: 3 Unlock