

Question: In this assignment, you will entering data into SPSS and running basic descriptive statistics, creating scales, and checking reliability. Enter your answers on this document
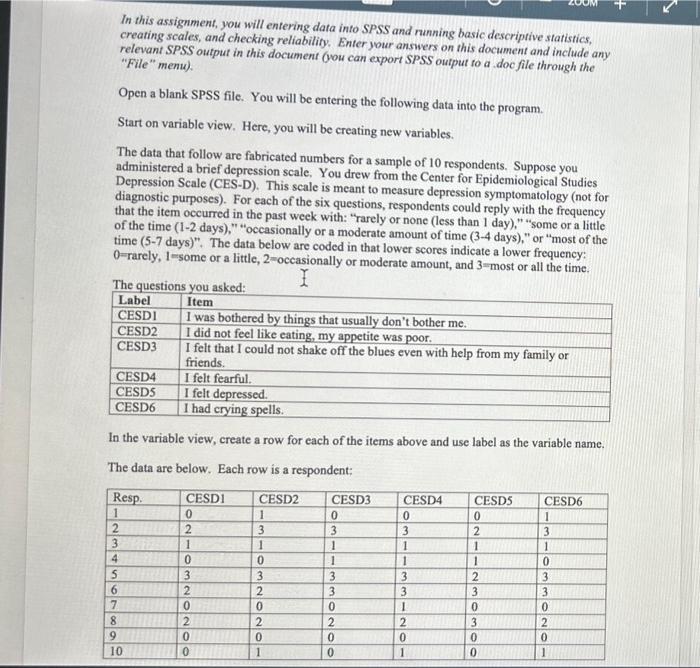
In this assignment, you will entering data into SPSS and running basic descriptive statistics, creating scales, and checking reliability. Enter your answers on this document and include any relevant SPSS output in this document (you can export SPSS output to a doc file through the "File" menu). Open a blank SPSS file. You will be entering the following data into the program. Start on variable view. Here, you will be creating new variables. The data that follow are fabricated numbers for a sample of 10 respondents. Suppose you administered a brief depression scale, You drew from the Center for Epidemiological Studies Depression Scale (CES-D). This scale is meant to measure depression symptomatology (not for diagnostic purposes). For each of the six questions, respondents could reply with the frequency that the item occurred in the past week with: "rarely or none (less than 1 day)," "some or a little of the time (1-2 days)," "occasionally or a moderate amount of time (3-4 days)," or "most of the time (5-7 days)". The data below are coded in that lower scores indicate a lower frequency: 0 -rarely, 1-some or a little, 2-occasionally or moderate amount, and 3=most or all the time. In the variable view, create a row for each of the items above and use label as the variable name. The data are below. Each row is a respondent
Step by Step Solution
There are 3 Steps involved in it

Get step-by-step solutions from verified subject matter experts