

Question: In this experiment, the pH optimum for a lactase tablet is being determined. I need to create a data table of pH, % transmittance, absorbance
In this experiment, the pH optimum for a lactase tablet is being determined. I need to create a data table of pH, % transmittance, absorbance and moles of product formed for all samples. How do I determine moles of product formed? Thanks for your help.
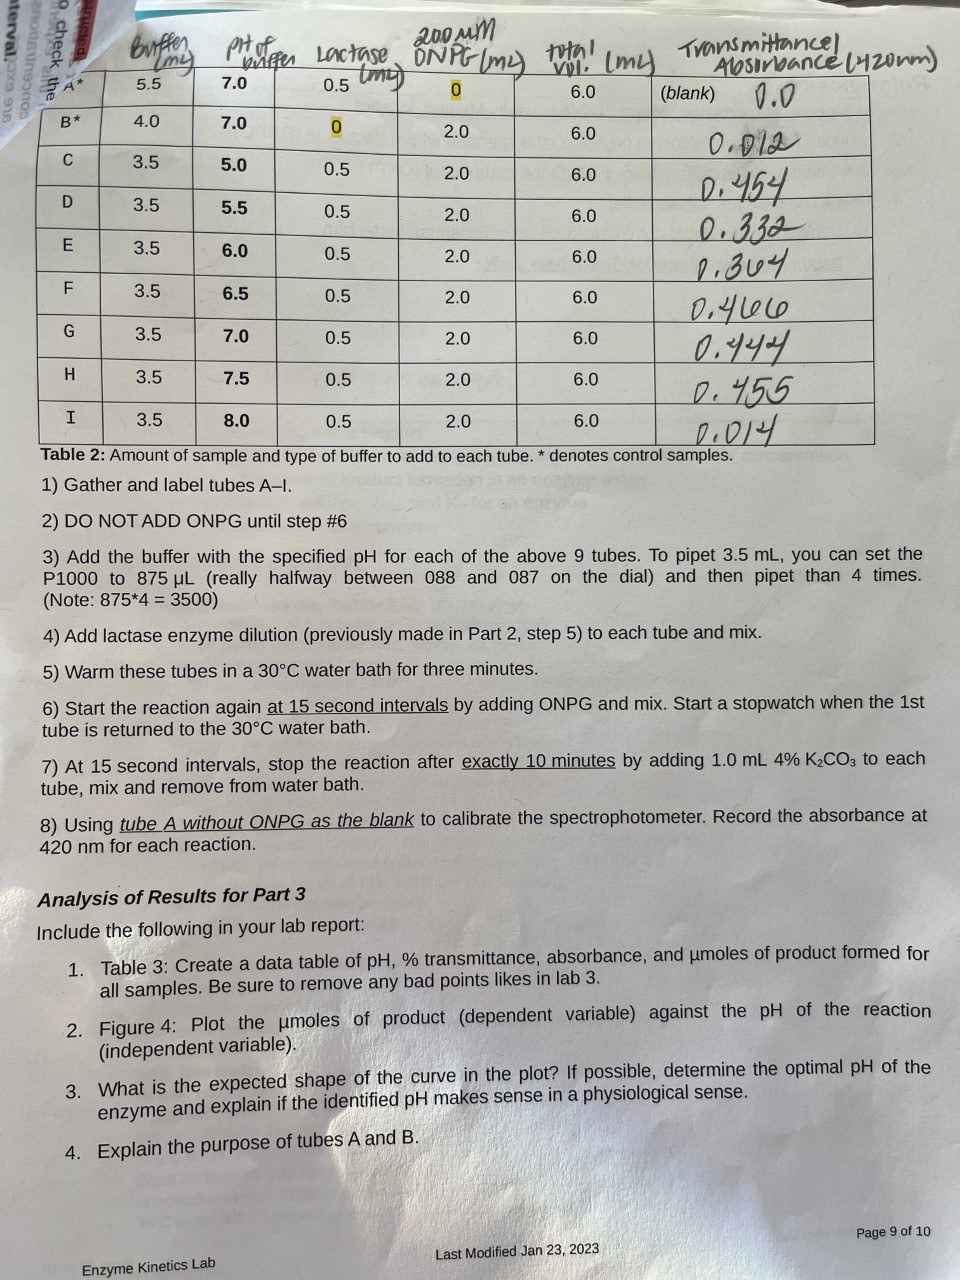
2) DO NOT ADD ONPG until step \#6 3) Add the buffer with the specified pH for each of the above 9 tubes. To pipet 3.5mL, you can set the P1000 to 875L (really halfway between 088 and 087 on the dial) and then pipet than 4 times. (Note: 8754=3500 ) 4) Add lactase enzyme dilution (previously made in Part 2, step 5) to each tube and mix. 5) Warm these tubes in a 30C water bath for three minutes. 6) Start the reaction again at 15 second intervals by adding ONPG and mix. Start a stopwatch when the 1st tube is returned to the 30C water bath. 7) At 15 second intervals, stop the reaction after exactly 10 minutes by adding 1.0mL4%K2CO3 to each tube, mix and remove from water bath. 8) Using tube A without ONPG as the blank to calibrate the spectrophotometer. Record the absorbance at 420nm for each reaction. Analysis of Results for Part 3 Include the following in your lab report: 1. Table 3: Create a data table of pH,% transmittance, absorbance, and moles of product formed for all samples. Be sure to remove any bad points likes in lab 3. 2. Figure 4: Plot the moles of product (dependent variable) against the pH of the reaction (independent variable). 3. What is the expected shape of the curve in the plot? If possible, determine the optimal pH of the enzyme and explain if the identified pH makes sense in a physiological sense. 4. Explain the purpose of tubes A and B. 2) DO NOT ADD ONPG until step \#6 3) Add the buffer with the specified pH for each of the above 9 tubes. To pipet 3.5mL, you can set the P1000 to 875L (really halfway between 088 and 087 on the dial) and then pipet than 4 times. (Note: 8754=3500 ) 4) Add lactase enzyme dilution (previously made in Part 2, step 5) to each tube and mix. 5) Warm these tubes in a 30C water bath for three minutes. 6) Start the reaction again at 15 second intervals by adding ONPG and mix. Start a stopwatch when the 1st tube is returned to the 30C water bath. 7) At 15 second intervals, stop the reaction after exactly 10 minutes by adding 1.0mL4%K2CO3 to each tube, mix and remove from water bath. 8) Using tube A without ONPG as the blank to calibrate the spectrophotometer. Record the absorbance at 420nm for each reaction. Analysis of Results for Part 3 Include the following in your lab report: 1. Table 3: Create a data table of pH,% transmittance, absorbance, and moles of product formed for all samples. Be sure to remove any bad points likes in lab 3. 2. Figure 4: Plot the moles of product (dependent variable) against the pH of the reaction (independent variable). 3. What is the expected shape of the curve in the plot? If possible, determine the optimal pH of the enzyme and explain if the identified pH makes sense in a physiological sense. 4. Explain the purpose of tubes A and B
Step by Step Solution
There are 3 Steps involved in it

Get step-by-step solutions from verified subject matter experts