

Question: In this homework, students will need to work and submit two files, one in Word and one in Excel. All the answers need to be
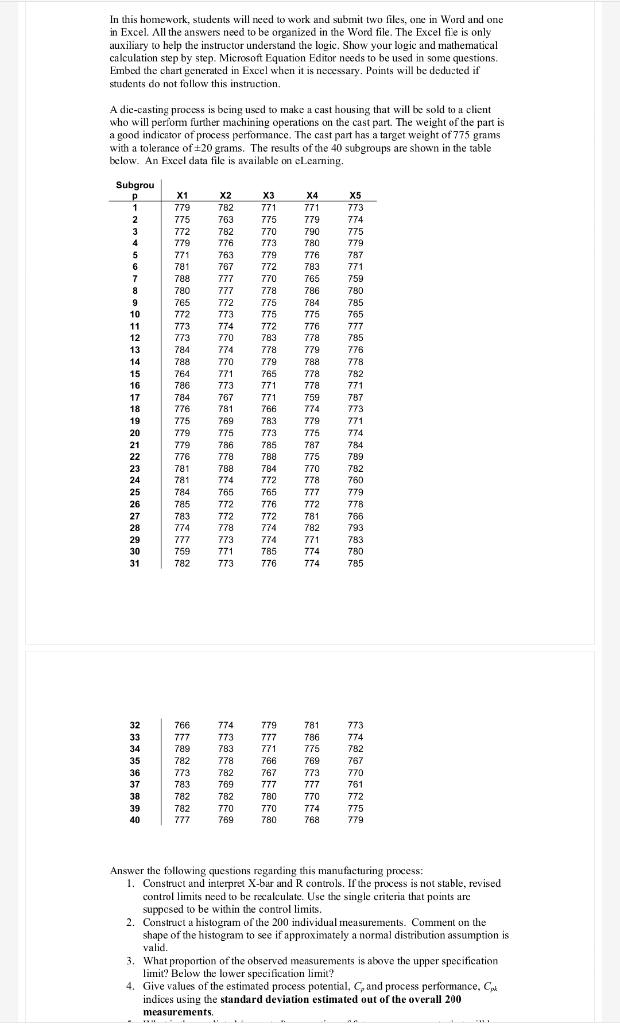
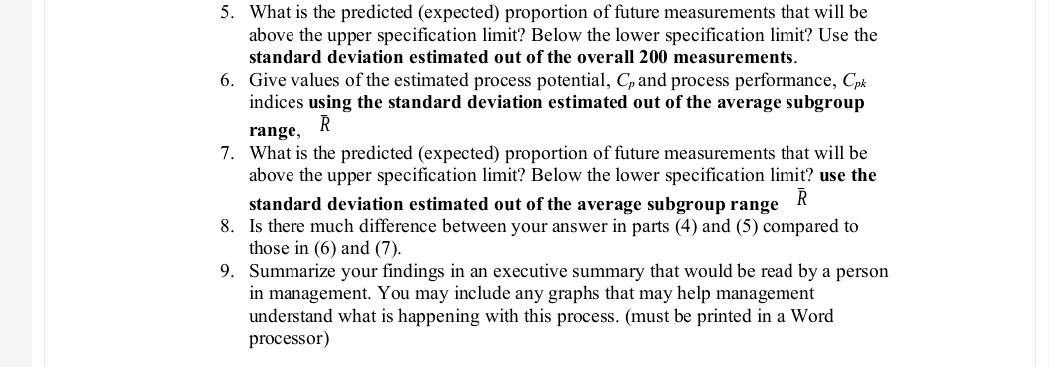
In this homework, students will need to work and submit two files, one in Word and one in Excel. All the answers need to be organized in the Word file. The Excel file is only auxiliary to help the instructor understand the logic. Show your logic and mathematical calculation step by step. Microsoft Equation Editor needs to be used in some questions Embed the chart generated in Excel when it is necessary. Points will be deducted if students do not follow this instruction, A dic-casting process is being used to make a cast housing that will be sold to a client who will perforn further machining operations on the cast part. The weight of the part is a good indicator of process perfomance. The cast part has a target weight of 775 grams with a tolerance of 20 grams. The results of the 40 subgroups are shown in the table below. An Excel data file is available on eLearning, Subgrou 1 2 3 4 5 6 7 8 9 10 11 12 13 14 15 16 17 18 19 20 21 22 23 24 25 26 27 28 29 30 31 HUBUBBHgnB8%%%%8m X1 779 775 772 779 771 781 789 780 765 772 773 773 784 788 764 786 784 776 775 779 779 776 781 781 784 785 783 774 777 759 782 X2 782 763 782 776 763 767 777 777 772 773 774 770 774 770 771 773 767 781 769 775 786 778 788 774 765 772 772 778 773 771 773 X3 771 775 770 773 779 772 770 778 775 775 772 783 778 779 765 771 771 766 783 773 785 788 784 772 765 776 772 774 774 785 776 X4 771 779 790 780 776 783 766 786 784 775 776 778 779 788 778 778 759 774 779 775 787 775 770 778 777 772 781 782 771 774 774 X5 773 774 775 779 787 771 759 780 785 765 777 785 776 778 782 771 787 773 771 774 784 789 782 760 779 778 766 793 783 780 785 32 33 34 35 36 37 38 39 40 766 777 789 782 773 783 782 782 777 774 773 783 778 782 769 782 770 769 779 777 771 766 767 777 780 770 780 781 786 775 769 773 777 770 774 768 773 774 782 767 770 761 772 775 779 Answer the following questions regarding this manufacturing process: 1. Construct and interpret X-bar and R controls. If the process is not stable, revised control limits need to be recalculate. Use the single criteria that points are supposed to be within the control limits. 2. Construct a histogram of the 200 individual measurements. Comment on the shape of the histogram to see if approximately a normal distribution assumption is valid. 3. What proportion of the observed measurements is above the upper specification limit? Below the lower specification limit? 4. Give values of the estimated process potential, C, and process performance, Ciut indices using the standard deviation estimated out of the overall 200 measurements I. 5. What is the predicted (expected) proportion of future measurements that will be above the upper specification limit? Below the lower specification limit? Use the standard deviation estimated out of the overall 200 measurements. 6. Give values of the estimated process potential, Cpand process performance, Cpk indices using the standard deviation estimated out of the average subgroup R range, 7. What is the predicted (expected) proportion of future measurements that will be above the upper specification limit? Below the lower specification limit? use the standard deviation estimated out of the average subgroup range R 8. Is there much difference between your answer in parts (4) and (5) compared to those in (6) and (7). 9. Summarize your findings in an executive summary that would be read by a person a in management. You may include any graphs that may help management understand what is happening with this process. (must be printed in a Word processor) In this homework, students will need to work and submit two files, one in Word and one in Excel. All the answers need to be organized in the Word file. The Excel file is only auxiliary to help the instructor understand the logic. Show your logic and mathematical calculation step by step. Microsoft Equation Editor needs to be used in some questions Embed the chart generated in Excel when it is necessary. Points will be deducted if students do not follow this instruction, A dic-casting process is being used to make a cast housing that will be sold to a client who will perforn further machining operations on the cast part. The weight of the part is a good indicator of process perfomance. The cast part has a target weight of 775 grams with a tolerance of 20 grams. The results of the 40 subgroups are shown in the table below. An Excel data file is available on eLearning, Subgrou 1 2 3 4 5 6 7 8 9 10 11 12 13 14 15 16 17 18 19 20 21 22 23 24 25 26 27 28 29 30 31 HUBUBBHgnB8%%%%8m X1 779 775 772 779 771 781 789 780 765 772 773 773 784 788 764 786 784 776 775 779 779 776 781 781 784 785 783 774 777 759 782 X2 782 763 782 776 763 767 777 777 772 773 774 770 774 770 771 773 767 781 769 775 786 778 788 774 765 772 772 778 773 771 773 X3 771 775 770 773 779 772 770 778 775 775 772 783 778 779 765 771 771 766 783 773 785 788 784 772 765 776 772 774 774 785 776 X4 771 779 790 780 776 783 766 786 784 775 776 778 779 788 778 778 759 774 779 775 787 775 770 778 777 772 781 782 771 774 774 X5 773 774 775 779 787 771 759 780 785 765 777 785 776 778 782 771 787 773 771 774 784 789 782 760 779 778 766 793 783 780 785 32 33 34 35 36 37 38 39 40 766 777 789 782 773 783 782 782 777 774 773 783 778 782 769 782 770 769 779 777 771 766 767 777 780 770 780 781 786 775 769 773 777 770 774 768 773 774 782 767 770 761 772 775 779 Answer the following questions regarding this manufacturing process: 1. Construct and interpret X-bar and R controls. If the process is not stable, revised control limits need to be recalculate. Use the single criteria that points are supposed to be within the control limits. 2. Construct a histogram of the 200 individual measurements. Comment on the shape of the histogram to see if approximately a normal distribution assumption is valid. 3. What proportion of the observed measurements is above the upper specification limit? Below the lower specification limit? 4. Give values of the estimated process potential, C, and process performance, Ciut indices using the standard deviation estimated out of the overall 200 measurements I. 5. What is the predicted (expected) proportion of future measurements that will be above the upper specification limit? Below the lower specification limit? Use the standard deviation estimated out of the overall 200 measurements. 6. Give values of the estimated process potential, Cpand process performance, Cpk indices using the standard deviation estimated out of the average subgroup R range, 7. What is the predicted (expected) proportion of future measurements that will be above the upper specification limit? Below the lower specification limit? use the standard deviation estimated out of the average subgroup range R 8. Is there much difference between your answer in parts (4) and (5) compared to those in (6) and (7). 9. Summarize your findings in an executive summary that would be read by a person a in management. You may include any graphs that may help management understand what is happening with this process. (must be printed in a Word processor)
Step by Step Solution
There are 3 Steps involved in it

Get step-by-step solutions from verified subject matter experts