

Question: In this next exercise, we will once again use the dataset of fake Russian accounts. I have produced both a histogram and a boxplot of
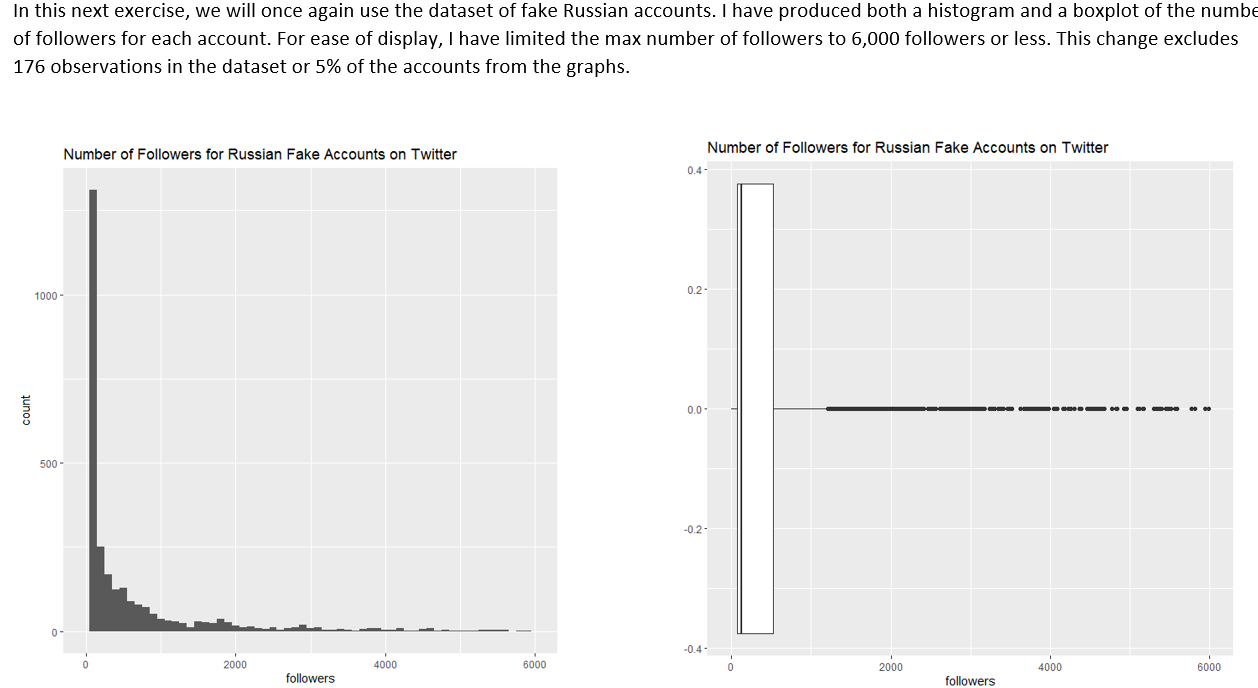
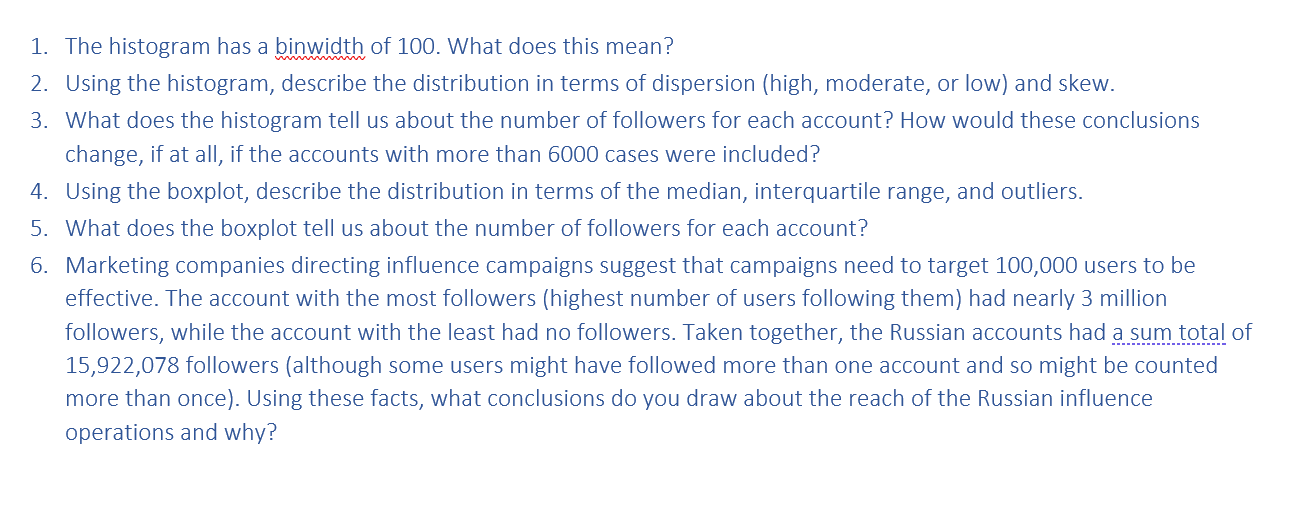
In this next exercise, we will once again use the dataset of fake Russian accounts. I have produced both a histogram and a boxplot of the numbe of followers for each account. For ease of display, I have limited the max number of followers to 6,000 followers or less. This change excludes 176 observations in the dataset or 5% of the accounts from the graphs. Number of Followers for Russian Fake Accounts on Twitter Number of Followers for Russian Fake Accounts on Twitter 0.4 0.2 1000 0.0 500 - -0.2- -0.4 2000 4000 6000 2000 4000 6000 followers followers 1. The histogram has a binwidth of 100. What does this mean? 2. Using the histogram, describe the distribution in terms of dispersion (high, moderate, or low) and skew. 3. What does the histogram tell us about the number of followers for each account? How would these conclusions change, if at all, if the accounts with more than 6000 cases were included? 4. Using the boxplot, describe the distribution in terms of the median, interquartile range, and outliers. 5. What does the boxplot tell us about the number of followers for each account? 6. Marketing companies directing influence campaigns suggest that campaigns need to target 100,000 users to be effective. The account with the most followers (highest number of users following them) had nearly 3 million followers, while the account with the least had no followers. Taken together, the Russian accounts had a sum total of 15,922,078 followers (although some users might have followed more than one account and so might be counted more than once). Using these facts, what conclusions do you draw about the reach of the Russian influence operations and why? In this next exercise, we will once again use the dataset of fake Russian accounts. I have produced both a histogram and a boxplot of the numbe of followers for each account. For ease of display, I have limited the max number of followers to 6,000 followers or less. This change excludes 176 observations in the dataset or 5% of the accounts from the graphs. Number of Followers for Russian Fake Accounts on Twitter Number of Followers for Russian Fake Accounts on Twitter 0.4 0.2 1000 0.0 500 - -0.2- -0.4 2000 4000 6000 2000 4000 6000 followers followers 1. The histogram has a binwidth of 100. What does this mean? 2. Using the histogram, describe the distribution in terms of dispersion (high, moderate, or low) and skew. 3. What does the histogram tell us about the number of followers for each account? How would these conclusions change, if at all, if the accounts with more than 6000 cases were included? 4. Using the boxplot, describe the distribution in terms of the median, interquartile range, and outliers. 5. What does the boxplot tell us about the number of followers for each account? 6. Marketing companies directing influence campaigns suggest that campaigns need to target 100,000 users to be effective. The account with the most followers (highest number of users following them) had nearly 3 million followers, while the account with the least had no followers. Taken together, the Russian accounts had a sum total of 15,922,078 followers (although some users might have followed more than one account and so might be counted more than once). Using these facts, what conclusions do you draw about the reach of the Russian influence operations and why
Step by Step Solution
There are 3 Steps involved in it

Get step-by-step solutions from verified subject matter experts