

Question: In this project you create a MATLAB script to plot two functions on one graph. Consider displacement of an object that is given by x
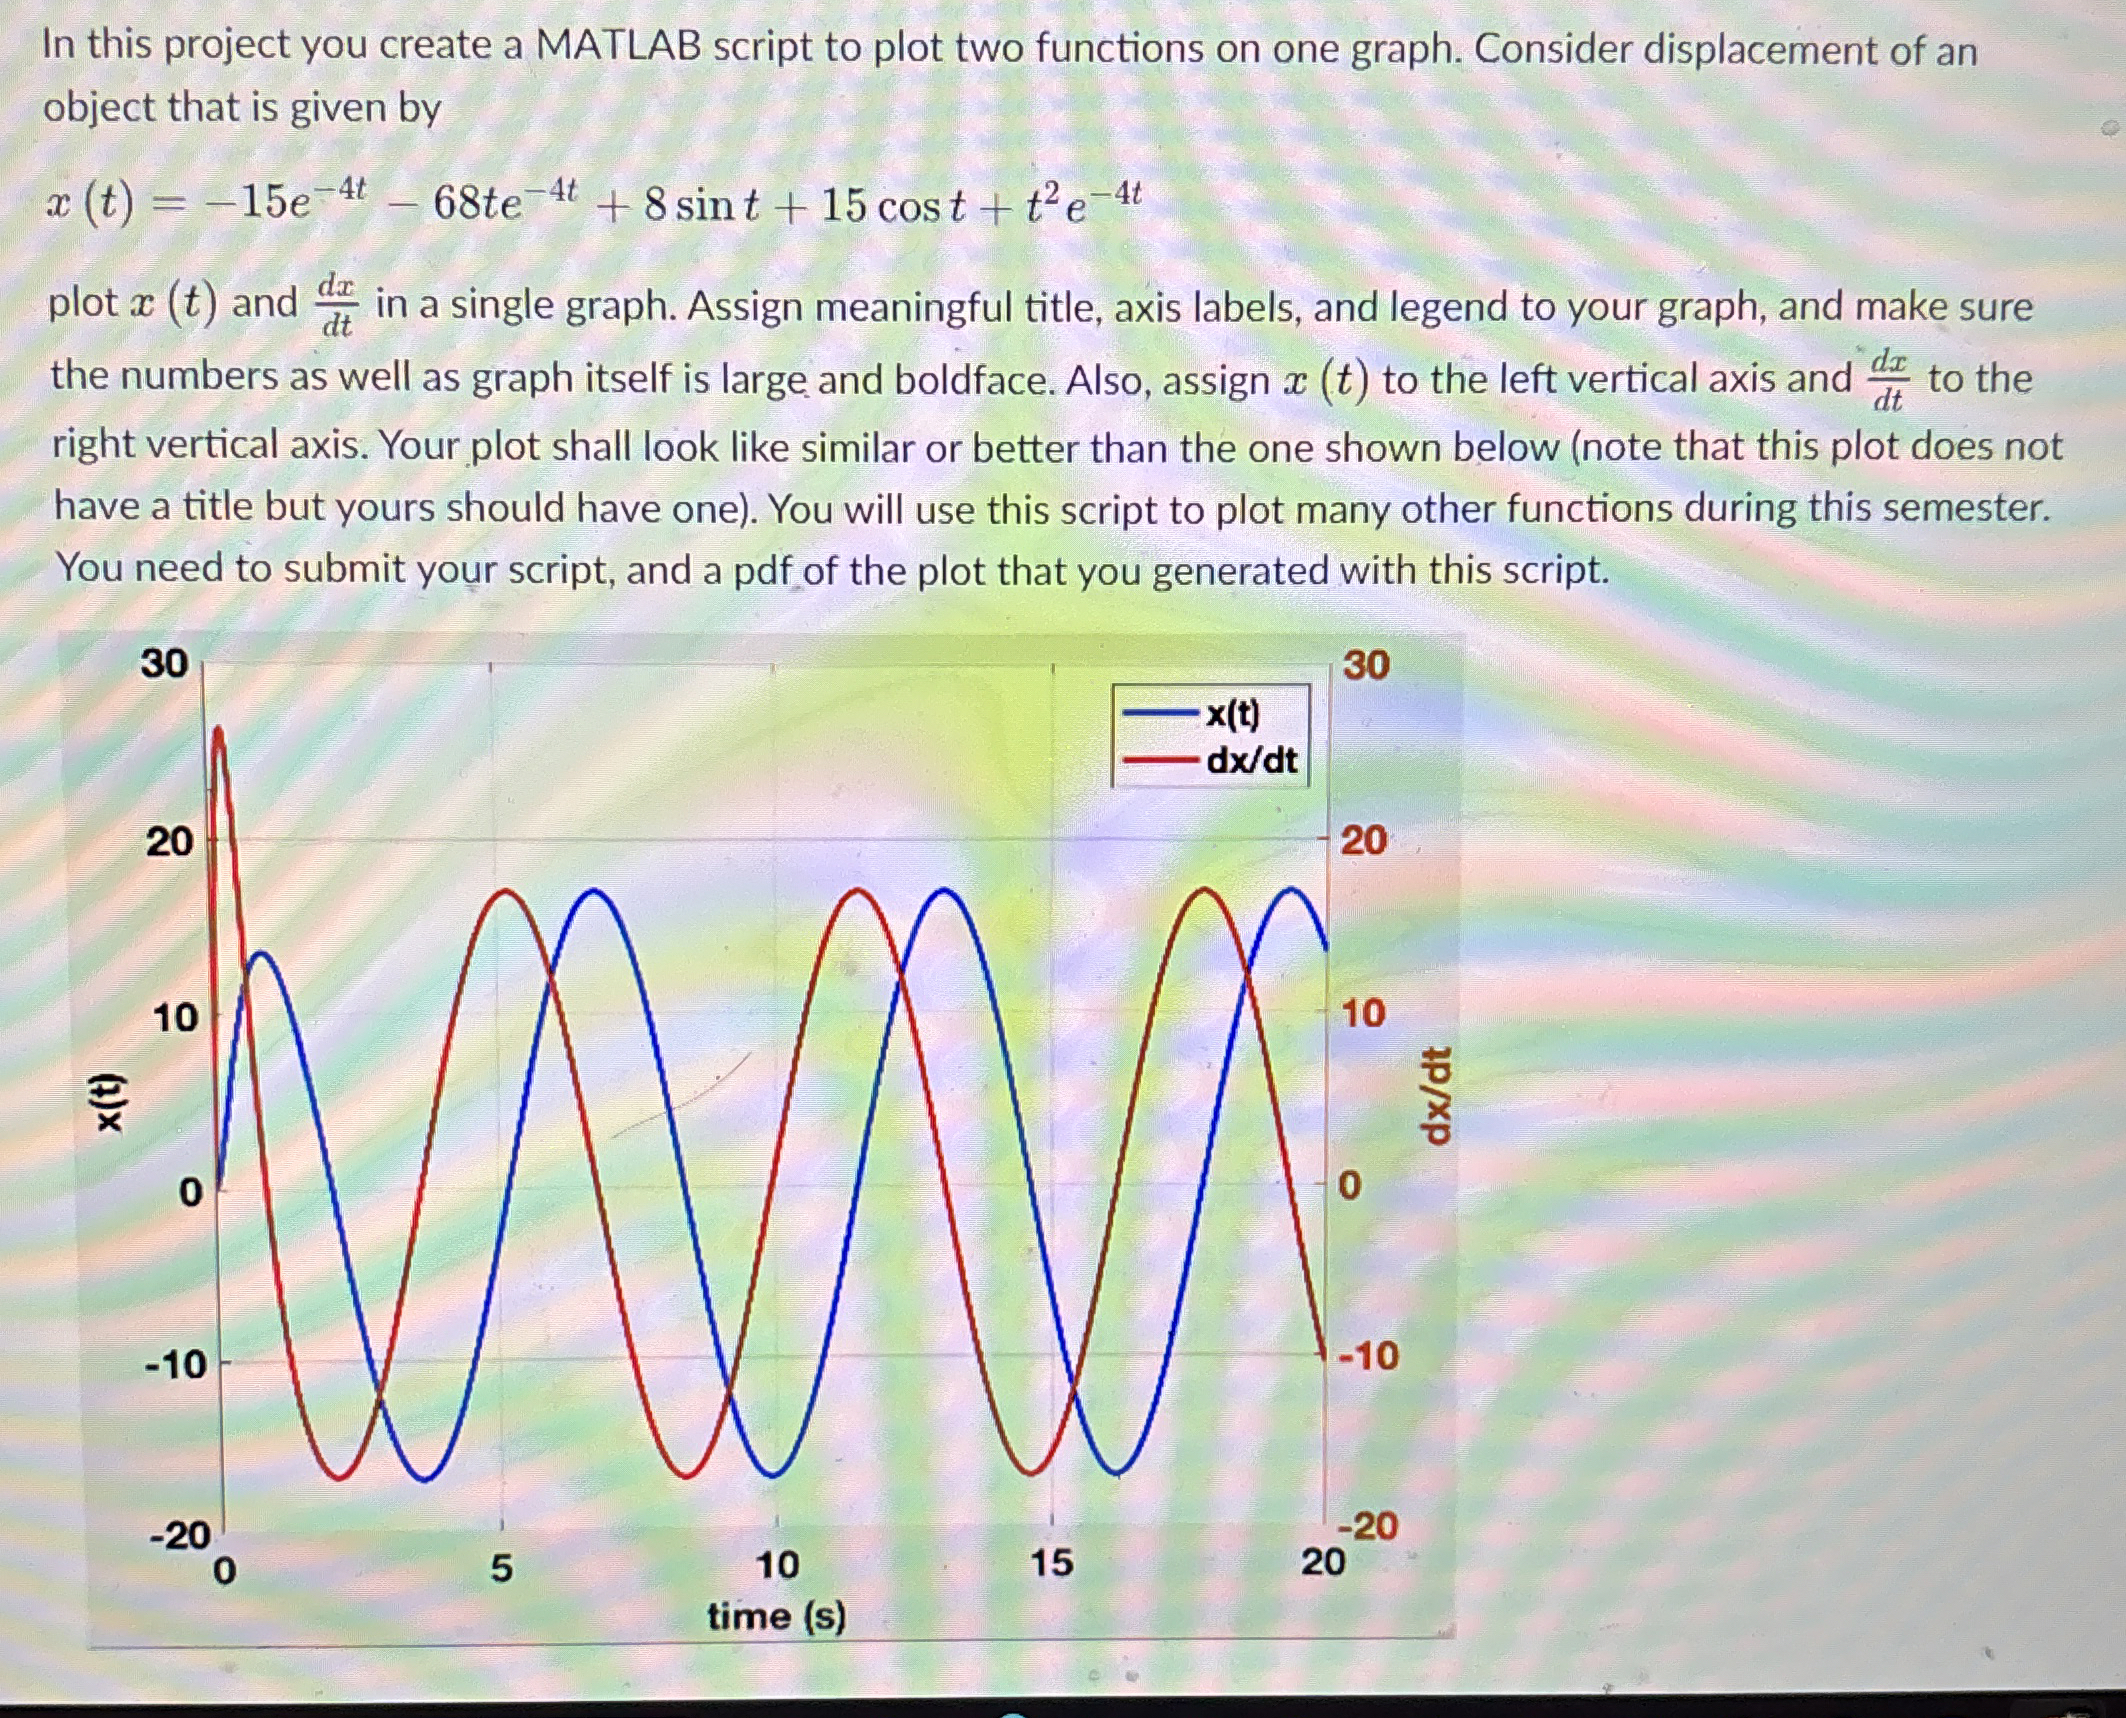
In this project you create a MATLAB script to plot two functions on one graph. Consider displacement of an
object that is given by
plot and in a single graph. Assign meaningful title, axis labels, and legend to your graph, and make sure
the numbers as well as graph itself is large and boldface. Also, assign to the left vertical axis and to the
right vertical axis. Your plot shall look like similar or better than the one shown below note that this plot does not
have a title but yours should have one You will use this script to plot many other functions during this semester.
You need to submit your script, and a pdf of the plot that you generated with this script.
Step by Step Solution
There are 3 Steps involved in it
1 Expert Approved Answer
Step: 1 Unlock

Question Has Been Solved by an Expert!
Get step-by-step solutions from verified subject matter experts
Step: 2 Unlock
Step: 3 Unlock