

Question: In this question, how we can get the X matrix for value M= 6. You will have to train and compare several regression models to
In this question, how we can get the X matrix for value M= 6.
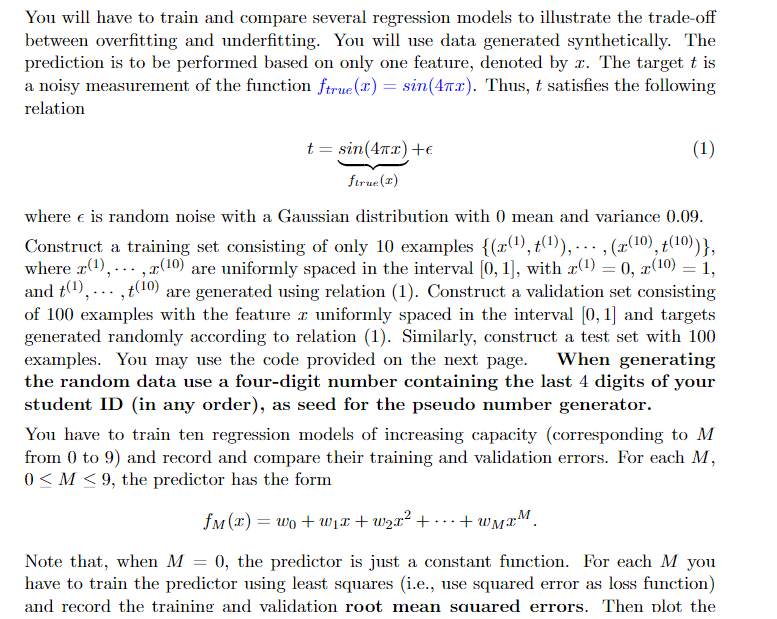
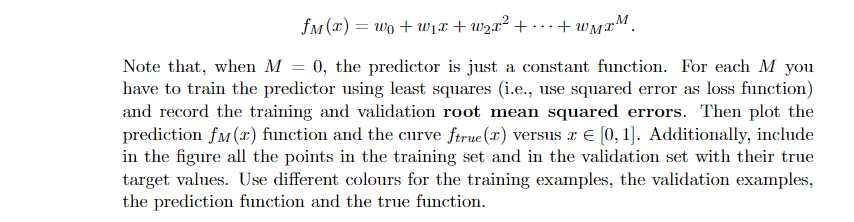
You will have to train and compare several regression models to illustrate the trade-off between overfitting and underfitting. You will use data generated synthetically. The prediction is to be performed based on only one feature, denoted by . The target t is a noisy measurement of the function ftrue (x) = sin(4x). Thus, t satisfies the following relation t = sin(4x) + ftrue (I) (1) where is random noise with a Gaussian distribution with 0 mean and variance 0.09. = 0, z (10) Construct a training set consisting of only 10 examples {(r(), t()),..., (x(10), t(10))}, where x(),..., (10) are uniformly spaced in the interval [0, 1], with () and t(),..., t(0) are generated using relation (1). Construct a validation set consisting of 100 examples with the feature z uniformly spaced in the interval [0, 1] and targets generated randomly according to relation (1). Similarly, construct a test set with 100 examples. You may use the code provided on the next page. When generating the random data use a four-digit number containing the last 4 digits of your student ID (in any order), as seed for the pseudo number generator. = 1, You have to train ten regression models of increasing capacity (corresponding to M from 0 to 9) and record and compare their training and validation errors. For each M, 0 M9, the predictor has the form fM(x) = wo+wx +wx + + WMIM. = Note that, when M 0, the predictor is just a constant function. For each M you have to train the predictor using least squares (i.e., use squared error as loss function) and record the training and validation root mean squared errors. Then plot the
Step by Step Solution
There are 3 Steps involved in it

Get step-by-step solutions from verified subject matter experts