

Question: In Visual Studio Code using Python, I was asked to work on this assignment attached in the file.Please make sure to do all the requirements
In Visual Studio Code using Python, I was asked to work on this assignment attached in the file.Please make sure to do all the requirements and use simple python code for beginners
Instructional Computer programming II TECH
College of Education Instructional & Learning Technology Department
Homework Assignment #
Python Data Analysis Assignment
Objective:
To gain handson experience in analyzing and visualizing data using Python, Pandas, and Matplotlib.
Dataset Description:
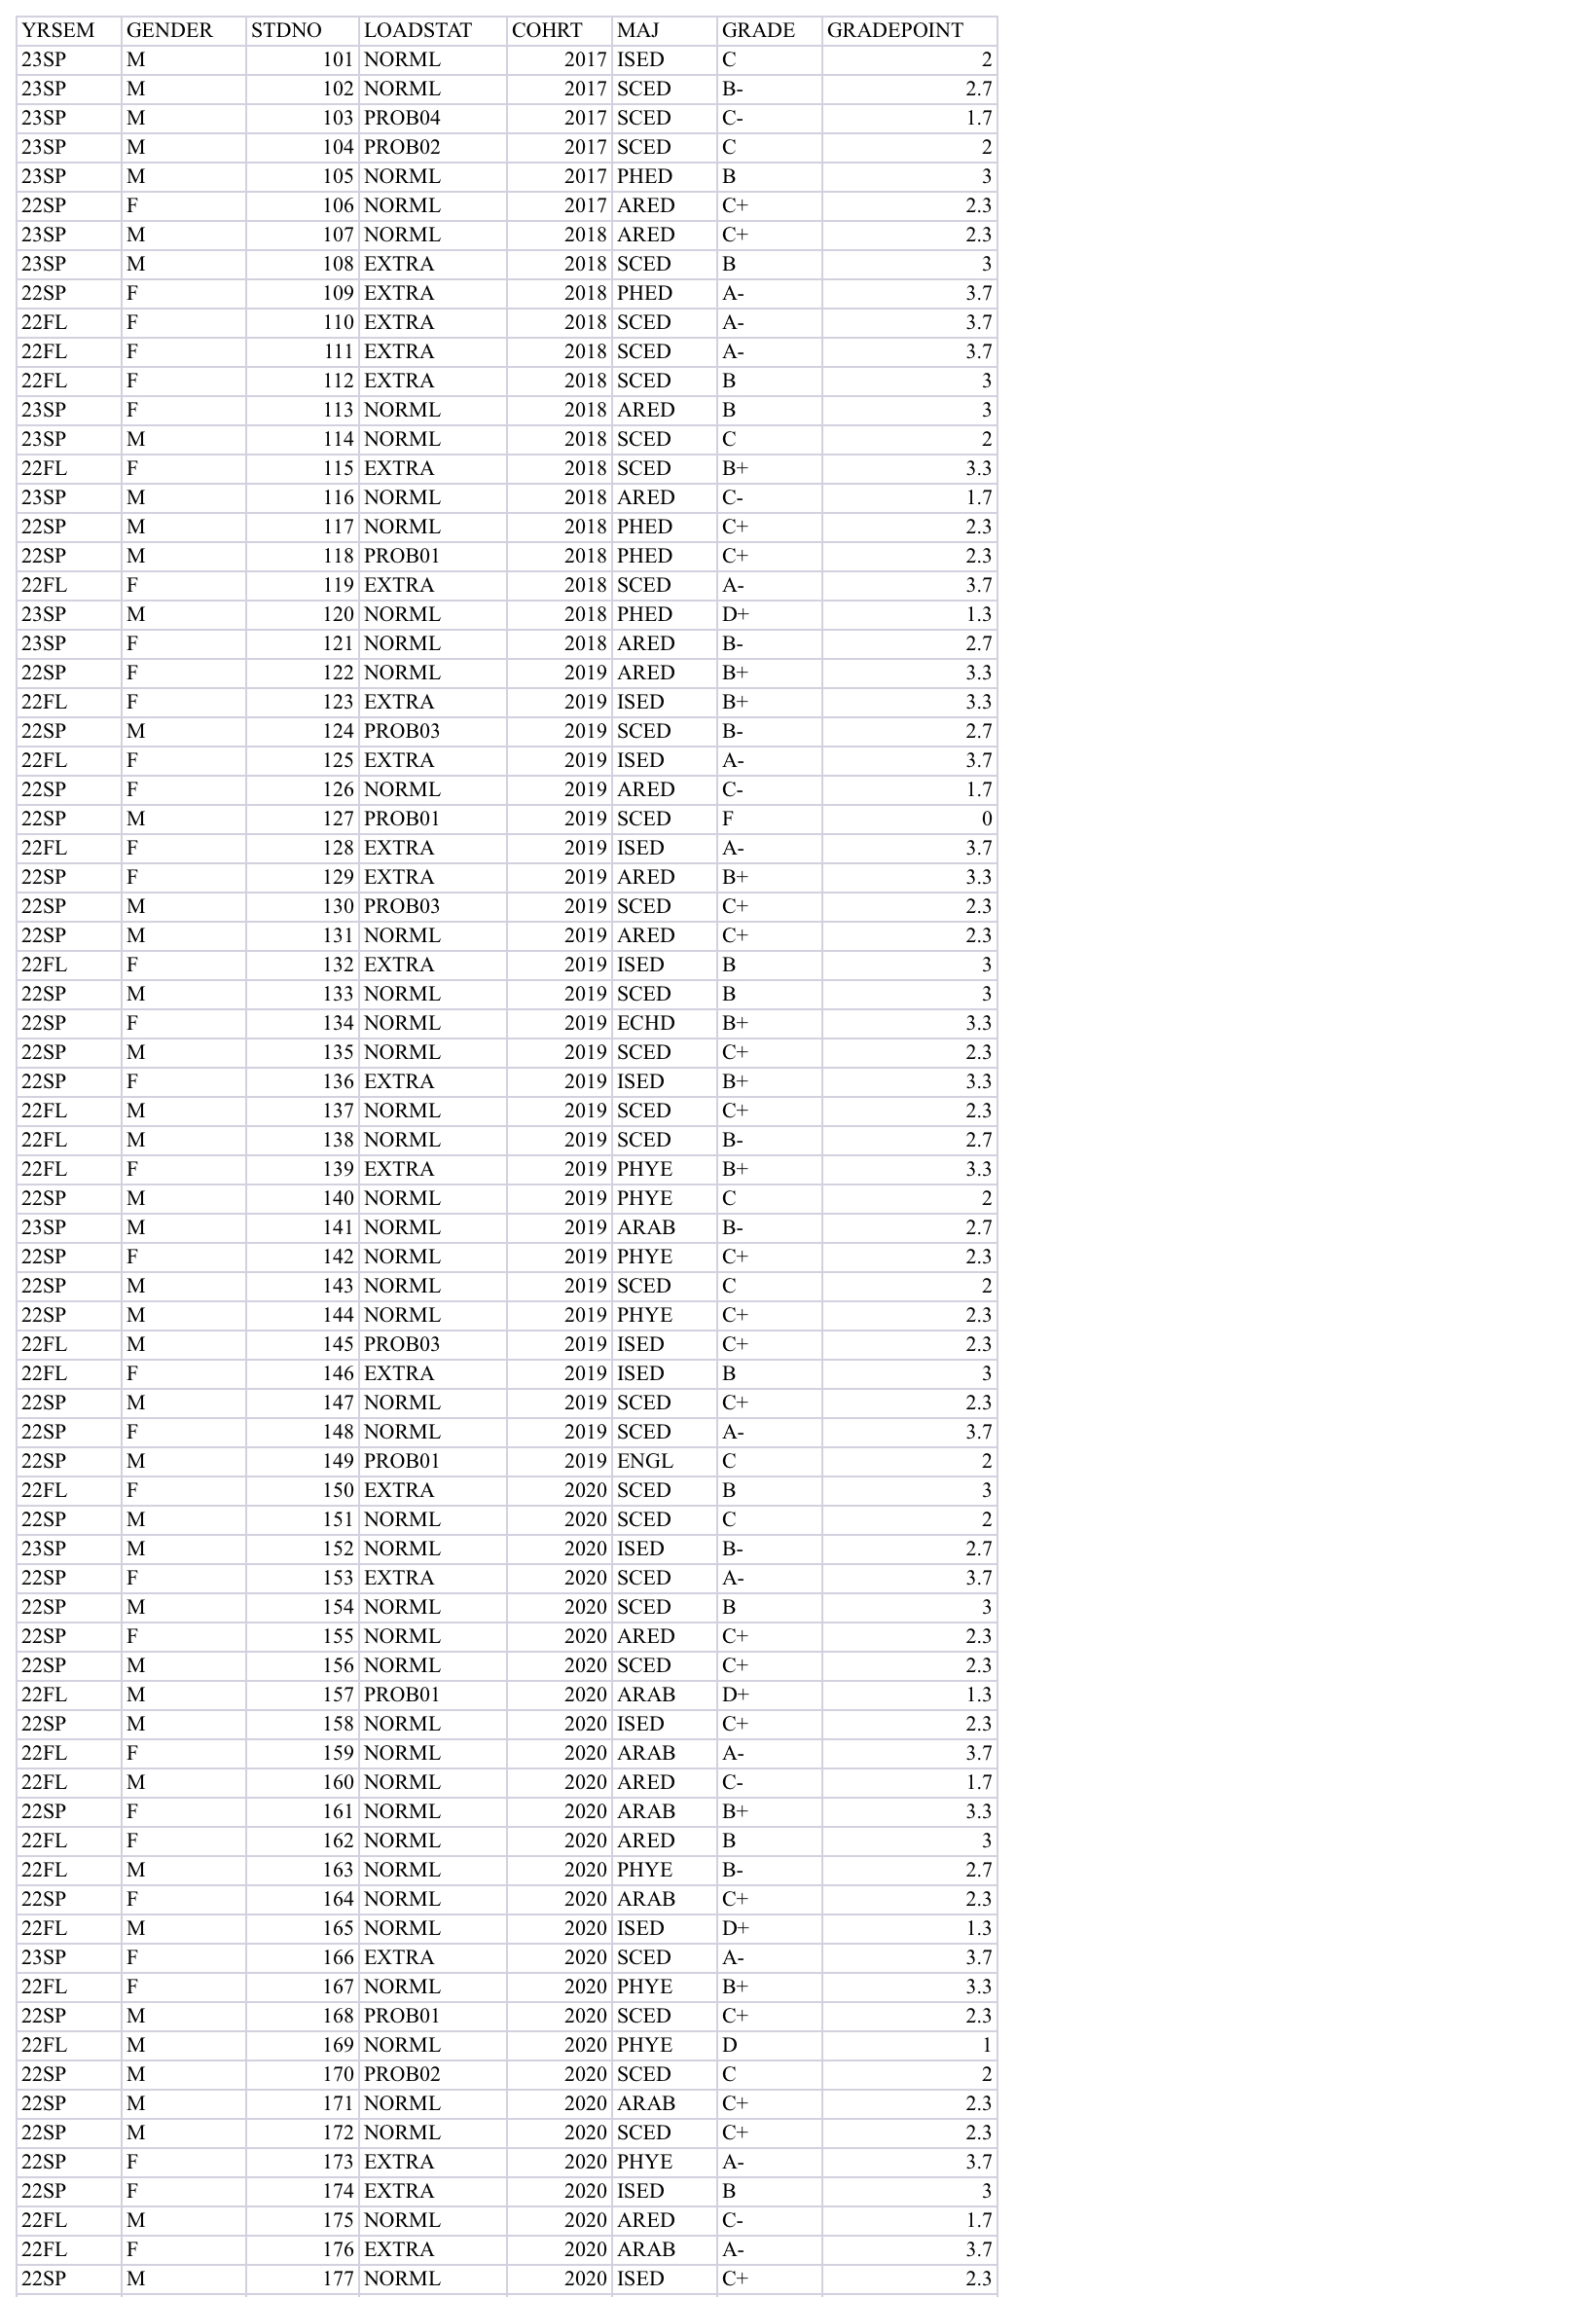
The provided XLSX file contains student records with the following columns:
YRSEM: Year and Semester
GENDER: Gender of the student
STDNO: Student number or ID
LOADSTAT: Load status of the student for the semester
COHRT: Cohort year
MAJ: Major of the student
GRADE: Grade obtained A B C D F
GRADEPOINT: Grade point corresponding to the grade
Tasks:
PassFail Analysis
a Create a summary table showing the count of pass and fail students for each YRSEM. Include columns: YRSEM, PASS, and FAIL.
b Use pie charts to show the percentage of pass and fail students per semester, customizing labels for clarity.
Grade Distribution Analysis
c Calculate the number of students scoring each grade A B C D and F for the semester SP
d Generate a bar chart with customized colors and annotations for the grade distribution for the semester SP
Peer Review:
Exchange your analysis with a fellow student. Review their work and provide constructive feedback. Focus on the methodology, clarity of visualization, and the insights derived.
Scoring Rubric
tableCriteriaUnsatisfied Needs Improvement Good Code Structure,tableCode is disorganized withno clear structuretableCode has some structurebut may be difficult tofollow in placestableCode is wellstructured,modular and easy tofollowCode Documentation,tableNo comments ordocumentation providedtableMinimal comments, someparts of the code are notdocumentedtableComprehensivecomments and cleardocumentationthroughout the codeAccuracy of Analysis atableIncorrect data or nosubmissionMinor errors in analysis,tableAccurate and completeanalysisAccuracy of Analysis btableIncorrect visualization orno submissiontableVisualization lacks clarityor detailtableClear and informativevisualizationAccuracy of Analysis ctableIncorrect data or nosubmissionMinor errors in analysis,tableAccurate and completeanalysistableClarity of Analysis dVisualizationtableUnclear or missingvisualizationtableVisualization lacks somedetailtableClear and informativevisualizationtableSignificance of AnalysistableChosen analysis lackssignificance or insighttableChosen analysis issomewhat insightfultableAnalysis is significant andoffers deep insightstableClarity of Analysis VisualizationtableUnclear or missingvisualizationtableVisualization lacks somedetailtableClear and informativevisualizationQuality of Peer Review,tableDoesnt provideconstructive feedbacktableProvides basic feedbackwithout much detailtableProvides detailed andconstructive feedback
Instructional Computer programming II TECH
College of Education Instructional & Learning Technology Department
Homework Assignment #
Python Data Analysis Assignment
Objective:
To gain handson experience in analyzing and visualizing data using Python, Pandas, and Matplotlib.
Dataset Description:
The provided XLSX file contains student records with the following columns:
YRSEM: Year and Semester
GENDER: Gender of the student
STDNO: Student number or ID
LOADSTAT: Load status of the student for the semester
COHRT: Cohort year
MAJ: Major of the student
GRADE: Grade obtained A B C D F
GRADEPOINT: Grade point corresponding to the grade
Tasks:
PassFail Analysis
a Create a summary table showing the count of pass and fail students for each YRSEM. Include columns: YRSEM, PASS, and FAIL.
b Use pie charts to show the percentage of pass and fail students per semester, customizing labels for clarity.
Grade Distribution Analysis
c Calculate the number of students scoring each grade A B C D and F for the semester SP
d Generate a bar chart with customized colors and annotations for the grade distribution for the semester SP
Peer Review:
Exchange your analysis with a fellow student. Review their work and provide constructive feedback. Focus on the methodology, clarity of visualization, and the insights derived.
Step by Step Solution
There are 3 Steps involved in it
1 Expert Approved Answer
Step: 1 Unlock

Question Has Been Solved by an Expert!
Get step-by-step solutions from verified subject matter experts
Step: 2 Unlock
Step: 3 Unlock