

Question: Income Statement Reported in Thousands except for Per Share Data FY13 FY14 Net revenue 1,528,545 2.218,767 Total costs and expenses 1.480,733 2.182.632 Loss from operations
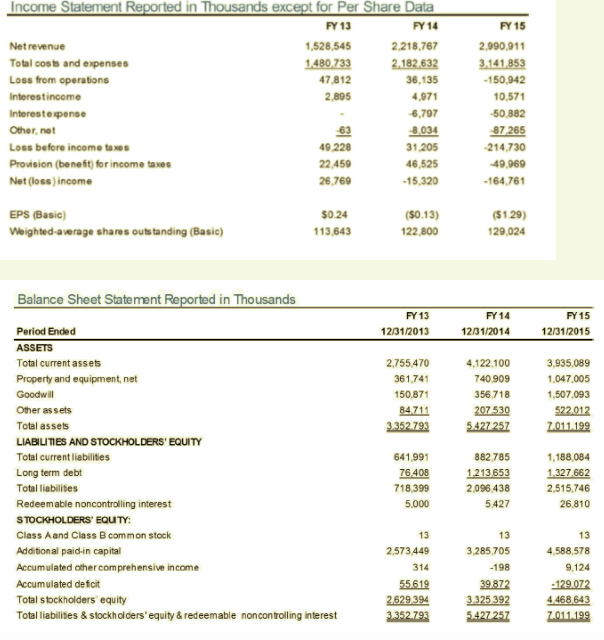
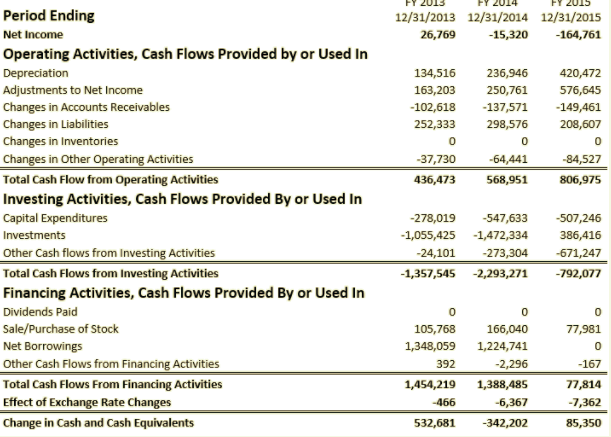
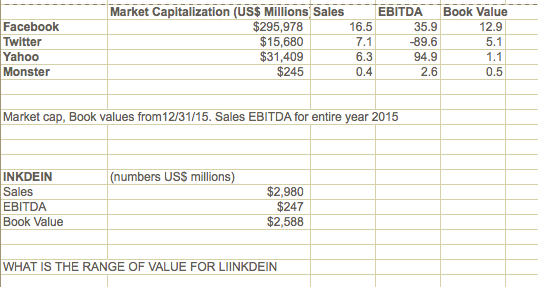
Income Statement Reported in Thousands except for Per Share Data FY13 FY14 Net revenue 1,528,545 2.218,767 Total costs and expenses 1.480,733 2.182.632 Loss from operations 47,812 36,135 Interestincome 2,895 4,971 Interestexpense -6,707 Other, net 8,034 Loss before income taxes 49,228 31,205 Provision (benefit for income taxes 22.450 46,525 Net (loss) income 26,769 -15,320 FY15 2,990,911 3.141.853 -150,942 10,571 -50,882 87.265 214,730 49,969 -164,761 63 EPS (Basic) Weighted average shares outstanding (Basie) $0.24 113,843 (50.13) 122,800 ($129) 129,024 Balance Sheet Statement Reported in Thousands FY13 12/31/2013 FY 14 12/31/2014 FY 15 12/31/2015 2.755.470 361.741 150,871 84711 3352.793 4.122.100 740909 356,718 207530 5.427257 3,935,089 1,047.005 1,507.093 522.012 2011.199 Period Ended ASSETS Total current assets Property and equipment net Goodwill Other assets Total assets LIABILITIES AND STOCKHOLDERS' EQUITY Total current liabilities Long term debt Total liabilities Redeemable noncontrolling interest STOCKHOLDERS' EQUTY: Class A and Class B common stock Additional paid-in capital Accumulated other comprehensive income Accumulated deficit Total stockholders equity Total liabilities & stockholders'equity & redeemable non controlling interest 641,991 76,408 718,399 5.000 882785 1213 653 2,096 438 5427 1,188,084 1.327,662 2,515.746 26,810 13 2,573 449 314 55619 2629394 3.352.793 13 3285 705 -198 39 872 3.325 392 5.427257 13 4.588.578 9,124 -129.072 4.468.643 7011.199 12/31/2013 12/31/2014 12/31/2015 26,769 -15,320 -164,761 134,516 163,203 -102,618 252,333 0 -37,730 436,473 236,946 250,761 - 137,571 298,576 0 -64,441 568,951 420,472 576,645 - 149,461 208,607 0 -84,527 806,975 Period Ending Net Income Operating Activities, Cash Flows Provided by or Used In Depreciation Adjustments to Net Income Changes in Accounts Receivables Changes in Liabilities Changes in Inventories Changes in Other Operating Activities Total Cash Flow from Operating Activities Investing Activities, Cash Flows Provided By or Used In Capital Expenditures Investments Other Cash flows from Investing Activities Total Cash Flows from Investing Activities Financing Activities, Cash Flows Provided By or Used In Dividends Paid Sale/Purchase of Stock Net Borrowings Other Cash Flows from Financing Activities Total Cash Flows From Financing Activities Effect of Exchange Rate Changes Change in Cash and Cash Equivalents -278,019 -547,633 -1,055,425 -1,472,334 -24,101 -273,304 -1,357,545 -2,293,271 -507,246 386,416 -671,247 -792,077 0 77,981 0 105,768 1,348,059 392 1,454,219 -466 532,681 0 166,040 1,224,741 -2,296 1,388,485 -6,367 -342,202 -167 77,814 -7,362 85,350 Facebook Twitter Yahoo Monster Market Capitalization (US$ Millions Sales EBITDA $295,978 16.5 35.9 $15,680 7.1 89.6 $31,409 6.3 94.9 $245 0.4 2.6 Book Value 12.9 5.1 1.1 0.5 Market cap, Book values from 12/31/15. Sales EBITDA for entire year 2015 (numbers US$ millions) INKDEIN Sales EBITDA Book Value $2,980 $247 $2,588 WHAT IS THE RANGE OF VALUE FOR LIINKDEIN Income Statement Reported in Thousands except for Per Share Data FY13 FY14 Net revenue 1,528,545 2.218,767 Total costs and expenses 1.480,733 2.182.632 Loss from operations 47,812 36,135 Interestincome 2,895 4,971 Interestexpense -6,707 Other, net 8,034 Loss before income taxes 49,228 31,205 Provision (benefit for income taxes 22.450 46,525 Net (loss) income 26,769 -15,320 FY15 2,990,911 3.141.853 -150,942 10,571 -50,882 87.265 214,730 49,969 -164,761 63 EPS (Basic) Weighted average shares outstanding (Basie) $0.24 113,843 (50.13) 122,800 ($129) 129,024 Balance Sheet Statement Reported in Thousands FY13 12/31/2013 FY 14 12/31/2014 FY 15 12/31/2015 2.755.470 361.741 150,871 84711 3352.793 4.122.100 740909 356,718 207530 5.427257 3,935,089 1,047.005 1,507.093 522.012 2011.199 Period Ended ASSETS Total current assets Property and equipment net Goodwill Other assets Total assets LIABILITIES AND STOCKHOLDERS' EQUITY Total current liabilities Long term debt Total liabilities Redeemable noncontrolling interest STOCKHOLDERS' EQUTY: Class A and Class B common stock Additional paid-in capital Accumulated other comprehensive income Accumulated deficit Total stockholders equity Total liabilities & stockholders'equity & redeemable non controlling interest 641,991 76,408 718,399 5.000 882785 1213 653 2,096 438 5427 1,188,084 1.327,662 2,515.746 26,810 13 2,573 449 314 55619 2629394 3.352.793 13 3285 705 -198 39 872 3.325 392 5.427257 13 4.588.578 9,124 -129.072 4.468.643 7011.199 12/31/2013 12/31/2014 12/31/2015 26,769 -15,320 -164,761 134,516 163,203 -102,618 252,333 0 -37,730 436,473 236,946 250,761 - 137,571 298,576 0 -64,441 568,951 420,472 576,645 - 149,461 208,607 0 -84,527 806,975 Period Ending Net Income Operating Activities, Cash Flows Provided by or Used In Depreciation Adjustments to Net Income Changes in Accounts Receivables Changes in Liabilities Changes in Inventories Changes in Other Operating Activities Total Cash Flow from Operating Activities Investing Activities, Cash Flows Provided By or Used In Capital Expenditures Investments Other Cash flows from Investing Activities Total Cash Flows from Investing Activities Financing Activities, Cash Flows Provided By or Used In Dividends Paid Sale/Purchase of Stock Net Borrowings Other Cash Flows from Financing Activities Total Cash Flows From Financing Activities Effect of Exchange Rate Changes Change in Cash and Cash Equivalents -278,019 -547,633 -1,055,425 -1,472,334 -24,101 -273,304 -1,357,545 -2,293,271 -507,246 386,416 -671,247 -792,077 0 77,981 0 105,768 1,348,059 392 1,454,219 -466 532,681 0 166,040 1,224,741 -2,296 1,388,485 -6,367 -342,202 -167 77,814 -7,362 85,350 Facebook Twitter Yahoo Monster Market Capitalization (US$ Millions Sales EBITDA $295,978 16.5 35.9 $15,680 7.1 89.6 $31,409 6.3 94.9 $245 0.4 2.6 Book Value 12.9 5.1 1.1 0.5 Market cap, Book values from 12/31/15. Sales EBITDA for entire year 2015 (numbers US$ millions) INKDEIN Sales EBITDA Book Value $2,980 $247 $2,588 WHAT IS THE RANGE OF VALUE FOR LIINKDEIN
Step by Step Solution
There are 3 Steps involved in it

Get step-by-step solutions from verified subject matter experts