

Question: Ine tracking signals computed using past demand history for three different products are as follows. Each product used the same forecasting technique. table [
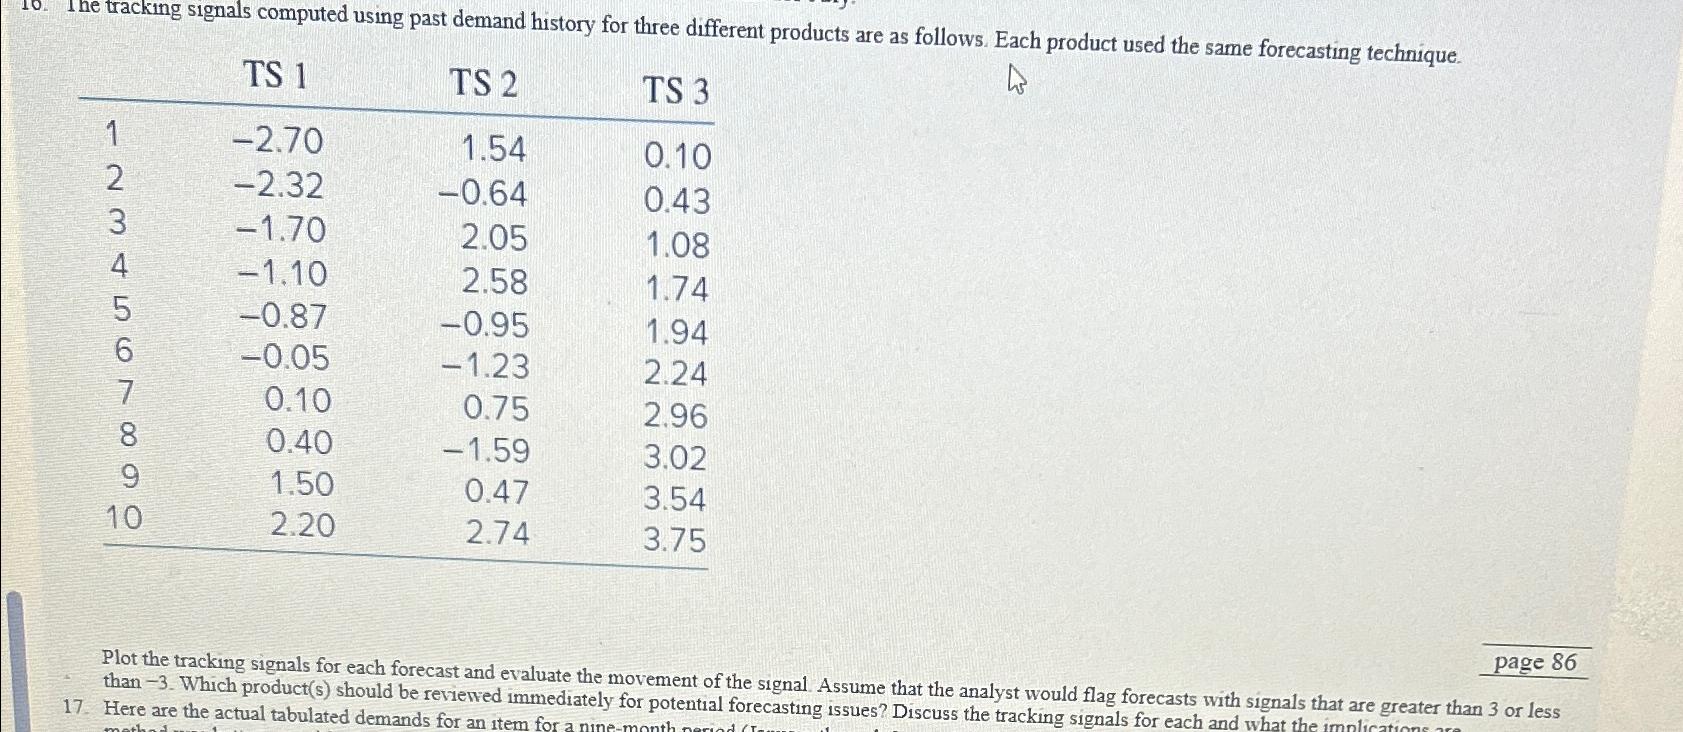
Ine tracking signals computed using past demand history for three different products are as follows. Each product used the same forecasting technique.
tableTS TS TS
page
Plot the tracking signals for each forecast and evaluate the movement of the signal. Assume that the analyst would flag forecasts with signals that are greater than or less
Here are the actual tabulated demands for an item fiately for potential forecasting issues? Discuss the tracking signals for each and what the implicationc or less
Step by Step Solution
There are 3 Steps involved in it
1 Expert Approved Answer
Step: 1 Unlock

Question Has Been Solved by an Expert!
Get step-by-step solutions from verified subject matter experts
Step: 2 Unlock
Step: 3 Unlock