

Information in the CFAR of the Town of Weston reported general capital assets un the following...
Fantastic news! We've Found the answer you've been seeking!
Question:
Transcribed Image Text:
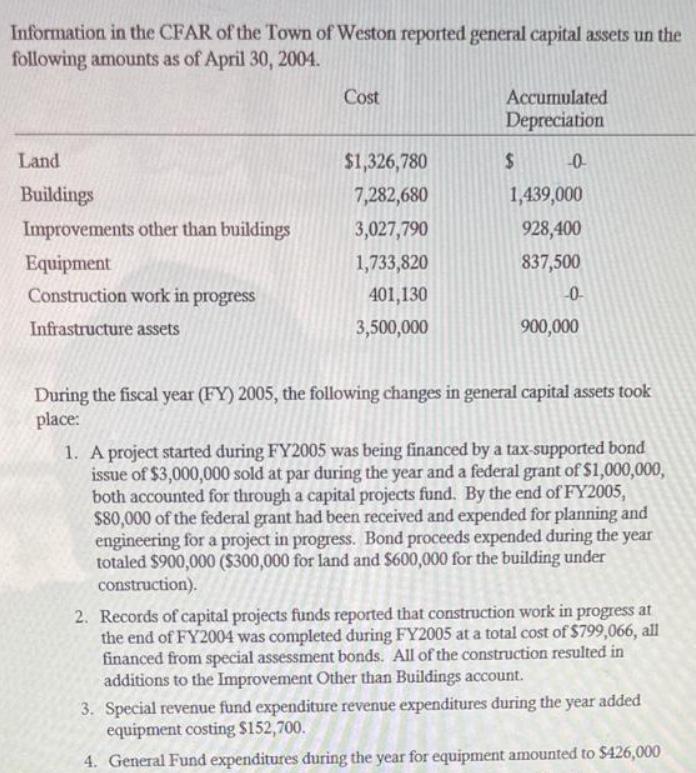
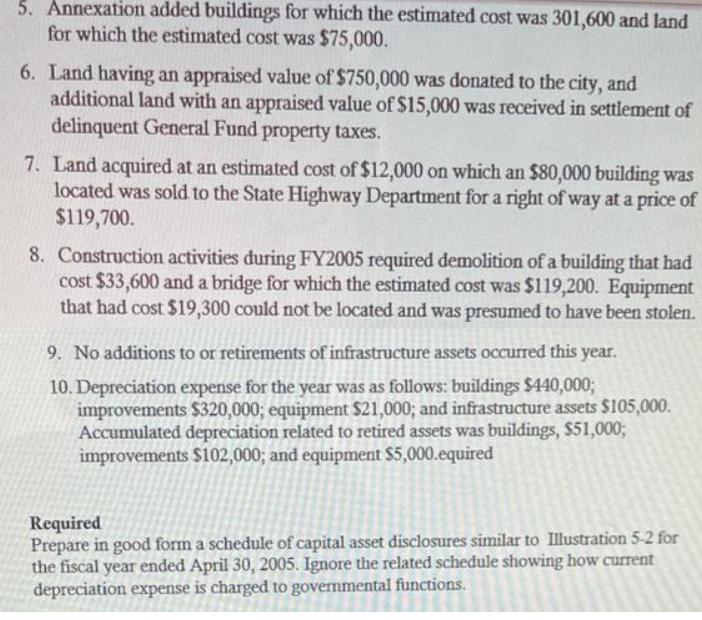
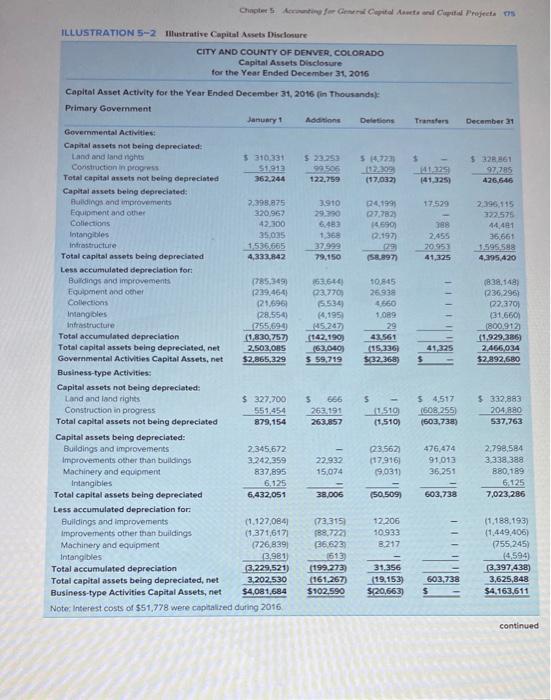
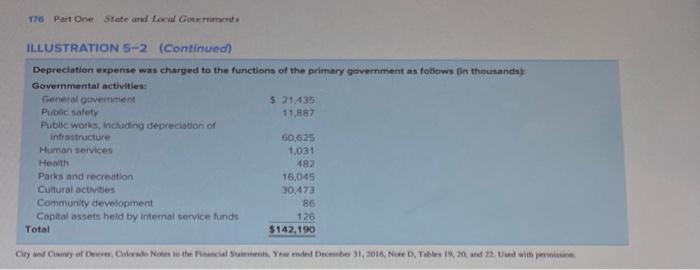
Information in the CFAR of the Town of Weston reported general capital assets un the following amounts as of April 30, 2004. Cost Accumulated Depreciation Land $1,326,780 24 0- Buildings 7,282,680 1,439,000 Improvements other than buildings 3,027,790 928,400 Equipment 1,733,820 837,500 Construction work in progress 401,130 0- Infrastructure assets 3,500,000 900,000 During the fiscal year (FY) 2005, the following changes in general capital assets took place: 1. A project started during FY2005 was being financed by a tax-supported bond issue of $3,000,000 sold at par during the year and a federal grant of $1,000,000, both accounted for through a capital projects fund. By the end of FY2005, $80,000 of the federal grant had been received and expended for planning and engineering for a project in progress. Bond proceeds expended during the year totaled $900,000 (S$300,000 for land and $600,000 for the building under construction). 2. Records of capital projects funds reported that construction work in progress at the end of FY2004 was completed during FY2005 at a total cost of $799,066, all financed from special assessment bonds. All of the construction resulted in additions to the Improvement Other than Buildings account. 3. Special revenue fund expenditure revenue expenditures during the year added equipment costing $152,700. 4. General Fund expenditures during the year for equipment amounted to $426,000 5. Annexation added buildings for which the estimated cost was 301,600 and land for which the estimated cost was $75,000. 6. Land having an appraised value of $750,000 was donated to the city, and additional land with an appraised value of $15,000 was received in settlement of delinquent General Fund property taxes. 7. Land acquired at an estimated cost of $12,000 on which an $80,000 building was located was sold to the State Highway Department for a right of way at a price of $119,700. 8. Construction activities during FY2005 required demolition of a building that had cost $33,600 and a bridge for which the estimated cost was $119,200. Equipment that had cost $19,300 could not be located and was presumed to have been stolen. 9. No additions to or retirements of infrastructure assets occurred this year. 10. Depreciation expense for the year was as follows: buildings $440,000; improvements $320,000; equipment $21,000; and infrastructure assets $105,000. Accumulated depreciation related to retired assets was buildings, $51,0003; improvements $102,000; and equipment $5,000.equired Required Prepare in good form a schedule of capital asset disclosures similar to Illustration 5-2 for the fiscal year ended April 30, 2005. Ignore the related schedule showing how current depreciation expense is charged to governmental functions. Chapter 5 Accnting fer Generl Capital Aaeta and Cipital Projecta s ILLUSTRATION 5-2 Illustrative Capital Assets Disclosure CITY AND COUNTY OF DENVER, COLORADO Capital Assets Disclosure for the Year Ended December 31, 2016 Capital Asset Activity for the Year Ended December 31, 2016 (in Thousands Primary Govermment January 1 Additions Deletions Transfers December 31 Governmental Activities: Capital assets not being depreciated: $ 310.331 51.913 Land and land nghts $ 23.253 S 14.72 $ 32R61 97.785 426,646 Construction in progress Total capital assets not being depreciated 362.244 122,759 (17,032) (41,325) Capital assets being depreciated: Buildings and improvements Equipment and other Colections Intangibles 2.398,875 320,967 42,300 3.910 29.390 24,199) 07.782) 14.690) 2.197) 17.529 2396,115 322575 6.483 388 44,481 35,035 1,536.665 2,455 20953 1,368 36,661 Intrastructure 37.999 79,150 1.595588 Total capital assets being depreciated 4,333842 (S8.897) 41,325 4,395,420 Less accumulated depreciation for: Buildings and improvements Equipment and other Collections (785349) (239.464) 10,845 26938 53.644) 03.770) (5.534) (4,195) 45.247) (142,190) (63,040) S 59,719 (838,148) (236,296) (21.696) 4660 02.370) (31,660) (800.912 (1.929.386) 2,466,034 $2.892,680 Intangibles Infrastructure (28,554) 1,089 29 (755,694) (1830.757) 2,503,085 Total accumulated depreciation Total capital assets being depreciated, net Governmental Activities Capital Assets, net 43561 (15336) S32.368) 41,325 $2,865,329 Business-type Activities: Capital assets not being depreciated: Land and land rights $ 327,700 551,454 $ 4,517 (608,255) 666 $ 332,883 263,191 263.857 Construction in progress 1510 (1,510) 204.880 Total capital assets not being depreciated 879,154 (503,738) 537,763 Capital assets being depreciated: Buildings and improvements Improvements other than buildings Machinery and equipment Intangibles 23.562 (17916) (9,031) 476,474 91,013 2.345,672 2,798,584 3242,359 22.932 3.338,388 837,895 15,074 36,251 B80,189 6.125 6,125 Total capital assets being depreciated 6,432,051 зароб క0,509 603,738 7,023,286 Less accumulated depreciation for: Buildings and improvements Improvements other than buildings Machinery and equipment Intangibles Total accumulated depreciation Total capital assets being depreciated, net Business-type Activities Capital Assets, net (1,188,193) (1,449,406) (755,245) (4.594) 3397,438) 12,206 (1,127,084) (1,371,617) (726,839) 3.981) 3.229,521) 3.202.530 (73,315) 88,722) 36,623) (613 (199.273) (161.267) $102.590 10.933 8217 31.356 (19,153) 603,738 3,625,848 $4,081,684 S20,663) $4.163.611 Note: Interest costs of $51,778 were capitalized duting 2016 continued 176 Part One State and Local Govermmente ILLUSTRATION 5-2 (Continued) Depreciation expense was charged to the functions of the primary government as follows (in thousands Governmental activities: General govemment Public safety Public works, including depreciation of infrastructure $ 21,435 11,887 60,625 Human services 1,031 Health 482 Parks and recreation 16,045 Cultural activities 30,473 Community development 86 Copital assets held by internal service funds 126 Total $142,190 Cty and Conty eof Denver, Colade Notes to the Financial Statement, Ye ended December 31, 2016, Nee D, Tables 19, 30, and 22 Ued with permission Information in the CFAR of the Town of Weston reported general capital assets un the following amounts as of April 30, 2004. Cost Accumulated Depreciation Land $1,326,780 24 0- Buildings 7,282,680 1,439,000 Improvements other than buildings 3,027,790 928,400 Equipment 1,733,820 837,500 Construction work in progress 401,130 0- Infrastructure assets 3,500,000 900,000 During the fiscal year (FY) 2005, the following changes in general capital assets took place: 1. A project started during FY2005 was being financed by a tax-supported bond issue of $3,000,000 sold at par during the year and a federal grant of $1,000,000, both accounted for through a capital projects fund. By the end of FY2005, $80,000 of the federal grant had been received and expended for planning and engineering for a project in progress. Bond proceeds expended during the year totaled $900,000 (S$300,000 for land and $600,000 for the building under construction). 2. Records of capital projects funds reported that construction work in progress at the end of FY2004 was completed during FY2005 at a total cost of $799,066, all financed from special assessment bonds. All of the construction resulted in additions to the Improvement Other than Buildings account. 3. Special revenue fund expenditure revenue expenditures during the year added equipment costing $152,700. 4. General Fund expenditures during the year for equipment amounted to $426,000 5. Annexation added buildings for which the estimated cost was 301,600 and land for which the estimated cost was $75,000. 6. Land having an appraised value of $750,000 was donated to the city, and additional land with an appraised value of $15,000 was received in settlement of delinquent General Fund property taxes. 7. Land acquired at an estimated cost of $12,000 on which an $80,000 building was located was sold to the State Highway Department for a right of way at a price of $119,700. 8. Construction activities during FY2005 required demolition of a building that had cost $33,600 and a bridge for which the estimated cost was $119,200. Equipment that had cost $19,300 could not be located and was presumed to have been stolen. 9. No additions to or retirements of infrastructure assets occurred this year. 10. Depreciation expense for the year was as follows: buildings $440,000; improvements $320,000; equipment $21,000; and infrastructure assets $105,000. Accumulated depreciation related to retired assets was buildings, $51,0003; improvements $102,000; and equipment $5,000.equired Required Prepare in good form a schedule of capital asset disclosures similar to Illustration 5-2 for the fiscal year ended April 30, 2005. Ignore the related schedule showing how current depreciation expense is charged to governmental functions. Chapter 5 Accnting fer Generl Capital Aaeta and Cipital Projecta s ILLUSTRATION 5-2 Illustrative Capital Assets Disclosure CITY AND COUNTY OF DENVER, COLORADO Capital Assets Disclosure for the Year Ended December 31, 2016 Capital Asset Activity for the Year Ended December 31, 2016 (in Thousands Primary Govermment January 1 Additions Deletions Transfers December 31 Governmental Activities: Capital assets not being depreciated: $ 310.331 51.913 Land and land nghts $ 23.253 S 14.72 $ 32R61 97.785 426,646 Construction in progress Total capital assets not being depreciated 362.244 122,759 (17,032) (41,325) Capital assets being depreciated: Buildings and improvements Equipment and other Colections Intangibles 2.398,875 320,967 42,300 3.910 29.390 24,199) 07.782) 14.690) 2.197) 17.529 2396,115 322575 6.483 388 44,481 35,035 1,536.665 2,455 20953 1,368 36,661 Intrastructure 37.999 79,150 1.595588 Total capital assets being depreciated 4,333842 (S8.897) 41,325 4,395,420 Less accumulated depreciation for: Buildings and improvements Equipment and other Collections (785349) (239.464) 10,845 26938 53.644) 03.770) (5.534) (4,195) 45.247) (142,190) (63,040) S 59,719 (838,148) (236,296) (21.696) 4660 02.370) (31,660) (800.912 (1.929.386) 2,466,034 $2.892,680 Intangibles Infrastructure (28,554) 1,089 29 (755,694) (1830.757) 2,503,085 Total accumulated depreciation Total capital assets being depreciated, net Governmental Activities Capital Assets, net 43561 (15336) S32.368) 41,325 $2,865,329 Business-type Activities: Capital assets not being depreciated: Land and land rights $ 327,700 551,454 $ 4,517 (608,255) 666 $ 332,883 263,191 263.857 Construction in progress 1510 (1,510) 204.880 Total capital assets not being depreciated 879,154 (503,738) 537,763 Capital assets being depreciated: Buildings and improvements Improvements other than buildings Machinery and equipment Intangibles 23.562 (17916) (9,031) 476,474 91,013 2.345,672 2,798,584 3242,359 22.932 3.338,388 837,895 15,074 36,251 B80,189 6.125 6,125 Total capital assets being depreciated 6,432,051 зароб క0,509 603,738 7,023,286 Less accumulated depreciation for: Buildings and improvements Improvements other than buildings Machinery and equipment Intangibles Total accumulated depreciation Total capital assets being depreciated, net Business-type Activities Capital Assets, net (1,188,193) (1,449,406) (755,245) (4.594) 3397,438) 12,206 (1,127,084) (1,371,617) (726,839) 3.981) 3.229,521) 3.202.530 (73,315) 88,722) 36,623) (613 (199.273) (161.267) $102.590 10.933 8217 31.356 (19,153) 603,738 3,625,848 $4,081,684 S20,663) $4.163.611 Note: Interest costs of $51,778 were capitalized duting 2016 continued 176 Part One State and Local Govermmente ILLUSTRATION 5-2 (Continued) Depreciation expense was charged to the functions of the primary government as follows (in thousands Governmental activities: General govemment Public safety Public works, including depreciation of infrastructure $ 21,435 11,887 60,625 Human services 1,031 Health 482 Parks and recreation 16,045 Cultural activities 30,473 Community development 86 Copital assets held by internal service funds 126 Total $142,190 Cty and Conty eof Denver, Colade Notes to the Financial Statement, Ye ended December 31, 2016, Nee D, Tables 19, 30, and 22 Ued with permission Information in the CFAR of the Town of Weston reported general capital assets un the following amounts as of April 30, 2004. Cost Accumulated Depreciation Land $1,326,780 24 0- Buildings 7,282,680 1,439,000 Improvements other than buildings 3,027,790 928,400 Equipment 1,733,820 837,500 Construction work in progress 401,130 0- Infrastructure assets 3,500,000 900,000 During the fiscal year (FY) 2005, the following changes in general capital assets took place: 1. A project started during FY2005 was being financed by a tax-supported bond issue of $3,000,000 sold at par during the year and a federal grant of $1,000,000, both accounted for through a capital projects fund. By the end of FY2005, $80,000 of the federal grant had been received and expended for planning and engineering for a project in progress. Bond proceeds expended during the year totaled $900,000 (S$300,000 for land and $600,000 for the building under construction). 2. Records of capital projects funds reported that construction work in progress at the end of FY2004 was completed during FY2005 at a total cost of $799,066, all financed from special assessment bonds. All of the construction resulted in additions to the Improvement Other than Buildings account. 3. Special revenue fund expenditure revenue expenditures during the year added equipment costing $152,700. 4. General Fund expenditures during the year for equipment amounted to $426,000 5. Annexation added buildings for which the estimated cost was 301,600 and land for which the estimated cost was $75,000. 6. Land having an appraised value of $750,000 was donated to the city, and additional land with an appraised value of $15,000 was received in settlement of delinquent General Fund property taxes. 7. Land acquired at an estimated cost of $12,000 on which an $80,000 building was located was sold to the State Highway Department for a right of way at a price of $119,700. 8. Construction activities during FY2005 required demolition of a building that had cost $33,600 and a bridge for which the estimated cost was $119,200. Equipment that had cost $19,300 could not be located and was presumed to have been stolen. 9. No additions to or retirements of infrastructure assets occurred this year. 10. Depreciation expense for the year was as follows: buildings $440,000; improvements $320,000; equipment $21,000; and infrastructure assets $105,000. Accumulated depreciation related to retired assets was buildings, $51,0003; improvements $102,000; and equipment $5,000.equired Required Prepare in good form a schedule of capital asset disclosures similar to Illustration 5-2 for the fiscal year ended April 30, 2005. Ignore the related schedule showing how current depreciation expense is charged to governmental functions. Chapter 5 Accnting fer Generl Capital Aaeta and Cipital Projecta s ILLUSTRATION 5-2 Illustrative Capital Assets Disclosure CITY AND COUNTY OF DENVER, COLORADO Capital Assets Disclosure for the Year Ended December 31, 2016 Capital Asset Activity for the Year Ended December 31, 2016 (in Thousands Primary Govermment January 1 Additions Deletions Transfers December 31 Governmental Activities: Capital assets not being depreciated: $ 310.331 51.913 Land and land nghts $ 23.253 S 14.72 $ 32R61 97.785 426,646 Construction in progress Total capital assets not being depreciated 362.244 122,759 (17,032) (41,325) Capital assets being depreciated: Buildings and improvements Equipment and other Colections Intangibles 2.398,875 320,967 42,300 3.910 29.390 24,199) 07.782) 14.690) 2.197) 17.529 2396,115 322575 6.483 388 44,481 35,035 1,536.665 2,455 20953 1,368 36,661 Intrastructure 37.999 79,150 1.595588 Total capital assets being depreciated 4,333842 (S8.897) 41,325 4,395,420 Less accumulated depreciation for: Buildings and improvements Equipment and other Collections (785349) (239.464) 10,845 26938 53.644) 03.770) (5.534) (4,195) 45.247) (142,190) (63,040) S 59,719 (838,148) (236,296) (21.696) 4660 02.370) (31,660) (800.912 (1.929.386) 2,466,034 $2.892,680 Intangibles Infrastructure (28,554) 1,089 29 (755,694) (1830.757) 2,503,085 Total accumulated depreciation Total capital assets being depreciated, net Governmental Activities Capital Assets, net 43561 (15336) S32.368) 41,325 $2,865,329 Business-type Activities: Capital assets not being depreciated: Land and land rights $ 327,700 551,454 $ 4,517 (608,255) 666 $ 332,883 263,191 263.857 Construction in progress 1510 (1,510) 204.880 Total capital assets not being depreciated 879,154 (503,738) 537,763 Capital assets being depreciated: Buildings and improvements Improvements other than buildings Machinery and equipment Intangibles 23.562 (17916) (9,031) 476,474 91,013 2.345,672 2,798,584 3242,359 22.932 3.338,388 837,895 15,074 36,251 B80,189 6.125 6,125 Total capital assets being depreciated 6,432,051 зароб క0,509 603,738 7,023,286 Less accumulated depreciation for: Buildings and improvements Improvements other than buildings Machinery and equipment Intangibles Total accumulated depreciation Total capital assets being depreciated, net Business-type Activities Capital Assets, net (1,188,193) (1,449,406) (755,245) (4.594) 3397,438) 12,206 (1,127,084) (1,371,617) (726,839) 3.981) 3.229,521) 3.202.530 (73,315) 88,722) 36,623) (613 (199.273) (161.267) $102.590 10.933 8217 31.356 (19,153) 603,738 3,625,848 $4,081,684 S20,663) $4.163.611 Note: Interest costs of $51,778 were capitalized duting 2016 continued 176 Part One State and Local Govermmente ILLUSTRATION 5-2 (Continued) Depreciation expense was charged to the functions of the primary government as follows (in thousands Governmental activities: General govemment Public safety Public works, including depreciation of infrastructure $ 21,435 11,887 60,625 Human services 1,031 Health 482 Parks and recreation 16,045 Cultural activities 30,473 Community development 86 Copital assets held by internal service funds 126 Total $142,190 Cty and Conty eof Denver, Colade Notes to the Financial Statement, Ye ended December 31, 2016, Nee D, Tables 19, 30, and 22 Ued with permission Information in the CFAR of the Town of Weston reported general capital assets un the following amounts as of April 30, 2004. Cost Accumulated Depreciation Land $1,326,780 24 0- Buildings 7,282,680 1,439,000 Improvements other than buildings 3,027,790 928,400 Equipment 1,733,820 837,500 Construction work in progress 401,130 0- Infrastructure assets 3,500,000 900,000 During the fiscal year (FY) 2005, the following changes in general capital assets took place: 1. A project started during FY2005 was being financed by a tax-supported bond issue of $3,000,000 sold at par during the year and a federal grant of $1,000,000, both accounted for through a capital projects fund. By the end of FY2005, $80,000 of the federal grant had been received and expended for planning and engineering for a project in progress. Bond proceeds expended during the year totaled $900,000 (S$300,000 for land and $600,000 for the building under construction). 2. Records of capital projects funds reported that construction work in progress at the end of FY2004 was completed during FY2005 at a total cost of $799,066, all financed from special assessment bonds. All of the construction resulted in additions to the Improvement Other than Buildings account. 3. Special revenue fund expenditure revenue expenditures during the year added equipment costing $152,700. 4. General Fund expenditures during the year for equipment amounted to $426,000 5. Annexation added buildings for which the estimated cost was 301,600 and land for which the estimated cost was $75,000. 6. Land having an appraised value of $750,000 was donated to the city, and additional land with an appraised value of $15,000 was received in settlement of delinquent General Fund property taxes. 7. Land acquired at an estimated cost of $12,000 on which an $80,000 building was located was sold to the State Highway Department for a right of way at a price of $119,700. 8. Construction activities during FY2005 required demolition of a building that had cost $33,600 and a bridge for which the estimated cost was $119,200. Equipment that had cost $19,300 could not be located and was presumed to have been stolen. 9. No additions to or retirements of infrastructure assets occurred this year. 10. Depreciation expense for the year was as follows: buildings $440,000; improvements $320,000; equipment $21,000; and infrastructure assets $105,000. Accumulated depreciation related to retired assets was buildings, $51,0003; improvements $102,000; and equipment $5,000.equired Required Prepare in good form a schedule of capital asset disclosures similar to Illustration 5-2 for the fiscal year ended April 30, 2005. Ignore the related schedule showing how current depreciation expense is charged to governmental functions. Chapter 5 Accnting fer Generl Capital Aaeta and Cipital Projecta s ILLUSTRATION 5-2 Illustrative Capital Assets Disclosure CITY AND COUNTY OF DENVER, COLORADO Capital Assets Disclosure for the Year Ended December 31, 2016 Capital Asset Activity for the Year Ended December 31, 2016 (in Thousands Primary Govermment January 1 Additions Deletions Transfers December 31 Governmental Activities: Capital assets not being depreciated: $ 310.331 51.913 Land and land nghts $ 23.253 S 14.72 $ 32R61 97.785 426,646 Construction in progress Total capital assets not being depreciated 362.244 122,759 (17,032) (41,325) Capital assets being depreciated: Buildings and improvements Equipment and other Colections Intangibles 2.398,875 320,967 42,300 3.910 29.390 24,199) 07.782) 14.690) 2.197) 17.529 2396,115 322575 6.483 388 44,481 35,035 1,536.665 2,455 20953 1,368 36,661 Intrastructure 37.999 79,150 1.595588 Total capital assets being depreciated 4,333842 (S8.897) 41,325 4,395,420 Less accumulated depreciation for: Buildings and improvements Equipment and other Collections (785349) (239.464) 10,845 26938 53.644) 03.770) (5.534) (4,195) 45.247) (142,190) (63,040) S 59,719 (838,148) (236,296) (21.696) 4660 02.370) (31,660) (800.912 (1.929.386) 2,466,034 $2.892,680 Intangibles Infrastructure (28,554) 1,089 29 (755,694) (1830.757) 2,503,085 Total accumulated depreciation Total capital assets being depreciated, net Governmental Activities Capital Assets, net 43561 (15336) S32.368) 41,325 $2,865,329 Business-type Activities: Capital assets not being depreciated: Land and land rights $ 327,700 551,454 $ 4,517 (608,255) 666 $ 332,883 263,191 263.857 Construction in progress 1510 (1,510) 204.880 Total capital assets not being depreciated 879,154 (503,738) 537,763 Capital assets being depreciated: Buildings and improvements Improvements other than buildings Machinery and equipment Intangibles 23.562 (17916) (9,031) 476,474 91,013 2.345,672 2,798,584 3242,359 22.932 3.338,388 837,895 15,074 36,251 B80,189 6.125 6,125 Total capital assets being depreciated 6,432,051 зароб క0,509 603,738 7,023,286 Less accumulated depreciation for: Buildings and improvements Improvements other than buildings Machinery and equipment Intangibles Total accumulated depreciation Total capital assets being depreciated, net Business-type Activities Capital Assets, net (1,188,193) (1,449,406) (755,245) (4.594) 3397,438) 12,206 (1,127,084) (1,371,617) (726,839) 3.981) 3.229,521) 3.202.530 (73,315) 88,722) 36,623) (613 (199.273) (161.267) $102.590 10.933 8217 31.356 (19,153) 603,738 3,625,848 $4,081,684 S20,663) $4.163.611 Note: Interest costs of $51,778 were capitalized duting 2016 continued 176 Part One State and Local Govermmente ILLUSTRATION 5-2 (Continued) Depreciation expense was charged to the functions of the primary government as follows (in thousands Governmental activities: General govemment Public safety Public works, including depreciation of infrastructure $ 21,435 11,887 60,625 Human services 1,031 Health 482 Parks and recreation 16,045 Cultural activities 30,473 Community development 86 Copital assets held by internal service funds 126 Total $142,190 Cty and Conty eof Denver, Colade Notes to the Financial Statement, Ye ended December 31, 2016, Nee D, Tables 19, 30, and 22 Ued with permission Information in the CFAR of the Town of Weston reported general capital assets un the following amounts as of April 30, 2004. Cost Accumulated Depreciation Land $1,326,780 24 0- Buildings 7,282,680 1,439,000 Improvements other than buildings 3,027,790 928,400 Equipment 1,733,820 837,500 Construction work in progress 401,130 0- Infrastructure assets 3,500,000 900,000 During the fiscal year (FY) 2005, the following changes in general capital assets took place: 1. A project started during FY2005 was being financed by a tax-supported bond issue of $3,000,000 sold at par during the year and a federal grant of $1,000,000, both accounted for through a capital projects fund. By the end of FY2005, $80,000 of the federal grant had been received and expended for planning and engineering for a project in progress. Bond proceeds expended during the year totaled $900,000 (S$300,000 for land and $600,000 for the building under construction). 2. Records of capital projects funds reported that construction work in progress at the end of FY2004 was completed during FY2005 at a total cost of $799,066, all financed from special assessment bonds. All of the construction resulted in additions to the Improvement Other than Buildings account. 3. Special revenue fund expenditure revenue expenditures during the year added equipment costing $152,700. 4. General Fund expenditures during the year for equipment amounted to $426,000 5. Annexation added buildings for which the estimated cost was 301,600 and land for which the estimated cost was $75,000. 6. Land having an appraised value of $750,000 was donated to the city, and additional land with an appraised value of $15,000 was received in settlement of delinquent General Fund property taxes. 7. Land acquired at an estimated cost of $12,000 on which an $80,000 building was located was sold to the State Highway Department for a right of way at a price of $119,700. 8. Construction activities during FY2005 required demolition of a building that had cost $33,600 and a bridge for which the estimated cost was $119,200. Equipment that had cost $19,300 could not be located and was presumed to have been stolen. 9. No additions to or retirements of infrastructure assets occurred this year. 10. Depreciation expense for the year was as follows: buildings $440,000; improvements $320,000; equipment $21,000; and infrastructure assets $105,000. Accumulated depreciation related to retired assets was buildings, $51,0003; improvements $102,000; and equipment $5,000.equired Required Prepare in good form a schedule of capital asset disclosures similar to Illustration 5-2 for the fiscal year ended April 30, 2005. Ignore the related schedule showing how current depreciation expense is charged to governmental functions. Chapter 5 Accnting fer Generl Capital Aaeta and Cipital Projecta s ILLUSTRATION 5-2 Illustrative Capital Assets Disclosure CITY AND COUNTY OF DENVER, COLORADO Capital Assets Disclosure for the Year Ended December 31, 2016 Capital Asset Activity for the Year Ended December 31, 2016 (in Thousands Primary Govermment January 1 Additions Deletions Transfers December 31 Governmental Activities: Capital assets not being depreciated: $ 310.331 51.913 Land and land nghts $ 23.253 S 14.72 $ 32R61 97.785 426,646 Construction in progress Total capital assets not being depreciated 362.244 122,759 (17,032) (41,325) Capital assets being depreciated: Buildings and improvements Equipment and other Colections Intangibles 2.398,875 320,967 42,300 3.910 29.390 24,199) 07.782) 14.690) 2.197) 17.529 2396,115 322575 6.483 388 44,481 35,035 1,536.665 2,455 20953 1,368 36,661 Intrastructure 37.999 79,150 1.595588 Total capital assets being depreciated 4,333842 (S8.897) 41,325 4,395,420 Less accumulated depreciation for: Buildings and improvements Equipment and other Collections (785349) (239.464) 10,845 26938 53.644) 03.770) (5.534) (4,195) 45.247) (142,190) (63,040) S 59,719 (838,148) (236,296) (21.696) 4660 02.370) (31,660) (800.912 (1.929.386) 2,466,034 $2.892,680 Intangibles Infrastructure (28,554) 1,089 29 (755,694) (1830.757) 2,503,085 Total accumulated depreciation Total capital assets being depreciated, net Governmental Activities Capital Assets, net 43561 (15336) S32.368) 41,325 $2,865,329 Business-type Activities: Capital assets not being depreciated: Land and land rights $ 327,700 551,454 $ 4,517 (608,255) 666 $ 332,883 263,191 263.857 Construction in progress 1510 (1,510) 204.880 Total capital assets not being depreciated 879,154 (503,738) 537,763 Capital assets being depreciated: Buildings and improvements Improvements other than buildings Machinery and equipment Intangibles 23.562 (17916) (9,031) 476,474 91,013 2.345,672 2,798,584 3242,359 22.932 3.338,388 837,895 15,074 36,251 B80,189 6.125 6,125 Total capital assets being depreciated 6,432,051 зароб క0,509 603,738 7,023,286 Less accumulated depreciation for: Buildings and improvements Improvements other than buildings Machinery and equipment Intangibles Total accumulated depreciation Total capital assets being depreciated, net Business-type Activities Capital Assets, net (1,188,193) (1,449,406) (755,245) (4.594) 3397,438) 12,206 (1,127,084) (1,371,617) (726,839) 3.981) 3.229,521) 3.202.530 (73,315) 88,722) 36,623) (613 (199.273) (161.267) $102.590 10.933 8217 31.356 (19,153) 603,738 3,625,848 $4,081,684 S20,663) $4.163.611 Note: Interest costs of $51,778 were capitalized duting 2016 continued 176 Part One State and Local Govermmente ILLUSTRATION 5-2 (Continued) Depreciation expense was charged to the functions of the primary government as follows (in thousands Governmental activities: General govemment Public safety Public works, including depreciation of infrastructure $ 21,435 11,887 60,625 Human services 1,031 Health 482 Parks and recreation 16,045 Cultural activities 30,473 Community development 86 Copital assets held by internal service funds 126 Total $142,190 Cty and Conty eof Denver, Colade Notes to the Financial Statement, Ye ended December 31, 2016, Nee D, Tables 19, 30, and 22 Ued with permission Information in the CFAR of the Town of Weston reported general capital assets un the following amounts as of April 30, 2004. Cost Accumulated Depreciation Land $1,326,780 24 0- Buildings 7,282,680 1,439,000 Improvements other than buildings 3,027,790 928,400 Equipment 1,733,820 837,500 Construction work in progress 401,130 0- Infrastructure assets 3,500,000 900,000 During the fiscal year (FY) 2005, the following changes in general capital assets took place: 1. A project started during FY2005 was being financed by a tax-supported bond issue of $3,000,000 sold at par during the year and a federal grant of $1,000,000, both accounted for through a capital projects fund. By the end of FY2005, $80,000 of the federal grant had been received and expended for planning and engineering for a project in progress. Bond proceeds expended during the year totaled $900,000 (S$300,000 for land and $600,000 for the building under construction). 2. Records of capital projects funds reported that construction work in progress at the end of FY2004 was completed during FY2005 at a total cost of $799,066, all financed from special assessment bonds. All of the construction resulted in additions to the Improvement Other than Buildings account. 3. Special revenue fund expenditure revenue expenditures during the year added equipment costing $152,700. 4. General Fund expenditures during the year for equipment amounted to $426,000 5. Annexation added buildings for which the estimated cost was 301,600 and land for which the estimated cost was $75,000. 6. Land having an appraised value of $750,000 was donated to the city, and additional land with an appraised value of $15,000 was received in settlement of delinquent General Fund property taxes. 7. Land acquired at an estimated cost of $12,000 on which an $80,000 building was located was sold to the State Highway Department for a right of way at a price of $119,700. 8. Construction activities during FY2005 required demolition of a building that had cost $33,600 and a bridge for which the estimated cost was $119,200. Equipment that had cost $19,300 could not be located and was presumed to have been stolen. 9. No additions to or retirements of infrastructure assets occurred this year. 10. Depreciation expense for the year was as follows: buildings $440,000; improvements $320,000; equipment $21,000; and infrastructure assets $105,000. Accumulated depreciation related to retired assets was buildings, $51,0003; improvements $102,000; and equipment $5,000.equired Required Prepare in good form a schedule of capital asset disclosures similar to Illustration 5-2 for the fiscal year ended April 30, 2005. Ignore the related schedule showing how current depreciation expense is charged to governmental functions. Chapter 5 Accnting fer Generl Capital Aaeta and Cipital Projecta s ILLUSTRATION 5-2 Illustrative Capital Assets Disclosure CITY AND COUNTY OF DENVER, COLORADO Capital Assets Disclosure for the Year Ended December 31, 2016 Capital Asset Activity for the Year Ended December 31, 2016 (in Thousands Primary Govermment January 1 Additions Deletions Transfers December 31 Governmental Activities: Capital assets not being depreciated: $ 310.331 51.913 Land and land nghts $ 23.253 S 14.72 $ 32R61 97.785 426,646 Construction in progress Total capital assets not being depreciated 362.244 122,759 (17,032) (41,325) Capital assets being depreciated: Buildings and improvements Equipment and other Colections Intangibles 2.398,875 320,967 42,300 3.910 29.390 24,199) 07.782) 14.690) 2.197) 17.529 2396,115 322575 6.483 388 44,481 35,035 1,536.665 2,455 20953 1,368 36,661 Intrastructure 37.999 79,150 1.595588 Total capital assets being depreciated 4,333842 (S8.897) 41,325 4,395,420 Less accumulated depreciation for: Buildings and improvements Equipment and other Collections (785349) (239.464) 10,845 26938 53.644) 03.770) (5.534) (4,195) 45.247) (142,190) (63,040) S 59,719 (838,148) (236,296) (21.696) 4660 02.370) (31,660) (800.912 (1.929.386) 2,466,034 $2.892,680 Intangibles Infrastructure (28,554) 1,089 29 (755,694) (1830.757) 2,503,085 Total accumulated depreciation Total capital assets being depreciated, net Governmental Activities Capital Assets, net 43561 (15336) S32.368) 41,325 $2,865,329 Business-type Activities: Capital assets not being depreciated: Land and land rights $ 327,700 551,454 $ 4,517 (608,255) 666 $ 332,883 263,191 263.857 Construction in progress 1510 (1,510) 204.880 Total capital assets not being depreciated 879,154 (503,738) 537,763 Capital assets being depreciated: Buildings and improvements Improvements other than buildings Machinery and equipment Intangibles 23.562 (17916) (9,031) 476,474 91,013 2.345,672 2,798,584 3242,359 22.932 3.338,388 837,895 15,074 36,251 B80,189 6.125 6,125 Total capital assets being depreciated 6,432,051 зароб క0,509 603,738 7,023,286 Less accumulated depreciation for: Buildings and improvements Improvements other than buildings Machinery and equipment Intangibles Total accumulated depreciation Total capital assets being depreciated, net Business-type Activities Capital Assets, net (1,188,193) (1,449,406) (755,245) (4.594) 3397,438) 12,206 (1,127,084) (1,371,617) (726,839) 3.981) 3.229,521) 3.202.530 (73,315) 88,722) 36,623) (613 (199.273) (161.267) $102.590 10.933 8217 31.356 (19,153) 603,738 3,625,848 $4,081,684 S20,663) $4.163.611 Note: Interest costs of $51,778 were capitalized duting 2016 continued 176 Part One State and Local Govermmente ILLUSTRATION 5-2 (Continued) Depreciation expense was charged to the functions of the primary government as follows (in thousands Governmental activities: General govemment Public safety Public works, including depreciation of infrastructure $ 21,435 11,887 60,625 Human services 1,031 Health 482 Parks and recreation 16,045 Cultural activities 30,473 Community development 86 Copital assets held by internal service funds 126 Total $142,190 Cty and Conty eof Denver, Colade Notes to the Financial Statement, Ye ended December 31, 2016, Nee D, Tables 19, 30, and 22 Ued with permission Information in the CFAR of the Town of Weston reported general capital assets un the following amounts as of April 30, 2004. Cost Accumulated Depreciation Land $1,326,780 24 0- Buildings 7,282,680 1,439,000 Improvements other than buildings 3,027,790 928,400 Equipment 1,733,820 837,500 Construction work in progress 401,130 0- Infrastructure assets 3,500,000 900,000 During the fiscal year (FY) 2005, the following changes in general capital assets took place: 1. A project started during FY2005 was being financed by a tax-supported bond issue of $3,000,000 sold at par during the year and a federal grant of $1,000,000, both accounted for through a capital projects fund. By the end of FY2005, $80,000 of the federal grant had been received and expended for planning and engineering for a project in progress. Bond proceeds expended during the year totaled $900,000 (S$300,000 for land and $600,000 for the building under construction). 2. Records of capital projects funds reported that construction work in progress at the end of FY2004 was completed during FY2005 at a total cost of $799,066, all financed from special assessment bonds. All of the construction resulted in additions to the Improvement Other than Buildings account. 3. Special revenue fund expenditure revenue expenditures during the year added equipment costing $152,700. 4. General Fund expenditures during the year for equipment amounted to $426,000 5. Annexation added buildings for which the estimated cost was 301,600 and land for which the estimated cost was $75,000. 6. Land having an appraised value of $750,000 was donated to the city, and additional land with an appraised value of $15,000 was received in settlement of delinquent General Fund property taxes. 7. Land acquired at an estimated cost of $12,000 on which an $80,000 building was located was sold to the State Highway Department for a right of way at a price of $119,700. 8. Construction activities during FY2005 required demolition of a building that had cost $33,600 and a bridge for which the estimated cost was $119,200. Equipment that had cost $19,300 could not be located and was presumed to have been stolen. 9. No additions to or retirements of infrastructure assets occurred this year. 10. Depreciation expense for the year was as follows: buildings $440,000; improvements $320,000; equipment $21,000; and infrastructure assets $105,000. Accumulated depreciation related to retired assets was buildings, $51,0003; improvements $102,000; and equipment $5,000.equired Required Prepare in good form a schedule of capital asset disclosures similar to Illustration 5-2 for the fiscal year ended April 30, 2005. Ignore the related schedule showing how current depreciation expense is charged to governmental functions. Chapter 5 Accnting fer Generl Capital Aaeta and Cipital Projecta s ILLUSTRATION 5-2 Illustrative Capital Assets Disclosure CITY AND COUNTY OF DENVER, COLORADO Capital Assets Disclosure for the Year Ended December 31, 2016 Capital Asset Activity for the Year Ended December 31, 2016 (in Thousands Primary Govermment January 1 Additions Deletions Transfers December 31 Governmental Activities: Capital assets not being depreciated: $ 310.331 51.913 Land and land nghts $ 23.253 S 14.72 $ 32R61 97.785 426,646 Construction in progress Total capital assets not being depreciated 362.244 122,759 (17,032) (41,325) Capital assets being depreciated: Buildings and improvements Equipment and other Colections Intangibles 2.398,875 320,967 42,300 3.910 29.390 24,199) 07.782) 14.690) 2.197) 17.529 2396,115 322575 6.483 388 44,481 35,035 1,536.665 2,455 20953 1,368 36,661 Intrastructure 37.999 79,150 1.595588 Total capital assets being depreciated 4,333842 (S8.897) 41,325 4,395,420 Less accumulated depreciation for: Buildings and improvements Equipment and other Collections (785349) (239.464) 10,845 26938 53.644) 03.770) (5.534) (4,195) 45.247) (142,190) (63,040) S 59,719 (838,148) (236,296) (21.696) 4660 02.370) (31,660) (800.912 (1.929.386) 2,466,034 $2.892,680 Intangibles Infrastructure (28,554) 1,089 29 (755,694) (1830.757) 2,503,085 Total accumulated depreciation Total capital assets being depreciated, net Governmental Activities Capital Assets, net 43561 (15336) S32.368) 41,325 $2,865,329 Business-type Activities: Capital assets not being depreciated: Land and land rights $ 327,700 551,454 $ 4,517 (608,255) 666 $ 332,883 263,191 263.857 Construction in progress 1510 (1,510) 204.880 Total capital assets not being depreciated 879,154 (503,738) 537,763 Capital assets being depreciated: Buildings and improvements Improvements other than buildings Machinery and equipment Intangibles 23.562 (17916) (9,031) 476,474 91,013 2.345,672 2,798,584 3242,359 22.932 3.338,388 837,895 15,074 36,251 B80,189 6.125 6,125 Total capital assets being depreciated 6,432,051 зароб క0,509 603,738 7,023,286 Less accumulated depreciation for: Buildings and improvements Improvements other than buildings Machinery and equipment Intangibles Total accumulated depreciation Total capital assets being depreciated, net Business-type Activities Capital Assets, net (1,188,193) (1,449,406) (755,245) (4.594) 3397,438) 12,206 (1,127,084) (1,371,617) (726,839) 3.981) 3.229,521) 3.202.530 (73,315) 88,722) 36,623) (613 (199.273) (161.267) $102.590 10.933 8217 31.356 (19,153) 603,738 3,625,848 $4,081,684 S20,663) $4.163.611 Note: Interest costs of $51,778 were capitalized duting 2016 continued 176 Part One State and Local Govermmente ILLUSTRATION 5-2 (Continued) Depreciation expense was charged to the functions of the primary government as follows (in thousands Governmental activities: General govemment Public safety Public works, including depreciation of infrastructure $ 21,435 11,887 60,625 Human services 1,031 Health 482 Parks and recreation 16,045 Cultural activities 30,473 Community development 86 Copital assets held by internal service funds 126 Total $142,190 Cty and Conty eof Denver, Colade Notes to the Financial Statement, Ye ended December 31, 2016, Nee D, Tables 19, 30, and 22 Ued with permission Information in the CFAR of the Town of Weston reported general capital assets un the following amounts as of April 30, 2004. Cost Accumulated Depreciation Land $1,326,780 24 0- Buildings 7,282,680 1,439,000 Improvements other than buildings 3,027,790 928,400 Equipment 1,733,820 837,500 Construction work in progress 401,130 0- Infrastructure assets 3,500,000 900,000 During the fiscal year (FY) 2005, the following changes in general capital assets took place: 1. A project started during FY2005 was being financed by a tax-supported bond issue of $3,000,000 sold at par during the year and a federal grant of $1,000,000, both accounted for through a capital projects fund. By the end of FY2005, $80,000 of the federal grant had been received and expended for planning and engineering for a project in progress. Bond proceeds expended during the year totaled $900,000 (S$300,000 for land and $600,000 for the building under construction). 2. Records of capital projects funds reported that construction work in progress at the end of FY2004 was completed during FY2005 at a total cost of $799,066, all financed from special assessment bonds. All of the construction resulted in additions to the Improvement Other than Buildings account. 3. Special revenue fund expenditure revenue expenditures during the year added equipment costing $152,700. 4. General Fund expenditures during the year for equipment amounted to $426,000 5. Annexation added buildings for which the estimated cost was 301,600 and land for which the estimated cost was $75,000. 6. Land having an appraised value of $750,000 was donated to the city, and additional land with an appraised value of $15,000 was received in settlement of delinquent General Fund property taxes. 7. Land acquired at an estimated cost of $12,000 on which an $80,000 building was located was sold to the State Highway Department for a right of way at a price of $119,700. 8. Construction activities during FY2005 required demolition of a building that had cost $33,600 and a bridge for which the estimated cost was $119,200. Equipment that had cost $19,300 could not be located and was presumed to have been stolen. 9. No additions to or retirements of infrastructure assets occurred this year. 10. Depreciation expense for the year was as follows: buildings $440,000; improvements $320,000; equipment $21,000; and infrastructure assets $105,000. Accumulated depreciation related to retired assets was buildings, $51,0003; improvements $102,000; and equipment $5,000.equired Required Prepare in good form a schedule of capital asset disclosures similar to Illustration 5-2 for the fiscal year ended April 30, 2005. Ignore the related schedule showing how current depreciation expense is charged to governmental functions. Chapter 5 Accnting fer Generl Capital Aaeta and Cipital Projecta s ILLUSTRATION 5-2 Illustrative Capital Assets Disclosure CITY AND COUNTY OF DENVER, COLORADO Capital Assets Disclosure for the Year Ended December 31, 2016 Capital Asset Activity for the Year Ended December 31, 2016 (in Thousands Primary Govermment January 1 Additions Deletions Transfers December 31 Governmental Activities: Capital assets not being depreciated: $ 310.331 51.913 Land and land nghts $ 23.253 S 14.72 $ 32R61 97.785 426,646 Construction in progress Total capital assets not being depreciated 362.244 122,759 (17,032) (41,325) Capital assets being depreciated: Buildings and improvements Equipment and other Colections Intangibles 2.398,875 320,967 42,300 3.910 29.390 24,199) 07.782) 14.690) 2.197) 17.529 2396,115 322575 6.483 388 44,481 35,035 1,536.665 2,455 20953 1,368 36,661 Intrastructure 37.999 79,150 1.595588 Total capital assets being depreciated 4,333842 (S8.897) 41,325 4,395,420 Less accumulated depreciation for: Buildings and improvements Equipment and other Collections (785349) (239.464) 10,845 26938 53.644) 03.770) (5.534) (4,195) 45.247) (142,190) (63,040) S 59,719 (838,148) (236,296) (21.696) 4660 02.370) (31,660) (800.912 (1.929.386) 2,466,034 $2.892,680 Intangibles Infrastructure (28,554) 1,089 29 (755,694) (1830.757) 2,503,085 Total accumulated depreciation Total capital assets being depreciated, net Governmental Activities Capital Assets, net 43561 (15336) S32.368) 41,325 $2,865,329 Business-type Activities: Capital assets not being depreciated: Land and land rights $ 327,700 551,454 $ 4,517 (608,255) 666 $ 332,883 263,191 263.857 Construction in progress 1510 (1,510) 204.880 Total capital assets not being depreciated 879,154 (503,738) 537,763 Capital assets being depreciated: Buildings and improvements Improvements other than buildings Machinery and equipment Intangibles 23.562 (17916) (9,031) 476,474 91,013 2.345,672 2,798,584 3242,359 22.932 3.338,388 837,895 15,074 36,251 B80,189 6.125 6,125 Total capital assets being depreciated 6,432,051 зароб క0,509 603,738 7,023,286 Less accumulated depreciation for: Buildings and improvements Improvements other than buildings Machinery and equipment Intangibles Total accumulated depreciation Total capital assets being depreciated, net Business-type Activities Capital Assets, net (1,188,193) (1,449,406) (755,245) (4.594) 3397,438) 12,206 (1,127,084) (1,371,617) (726,839) 3.981) 3.229,521) 3.202.530 (73,315) 88,722) 36,623) (613 (199.273) (161.267) $102.590 10.933 8217 31.356 (19,153) 603,738 3,625,848 $4,081,684 S20,663) $4.163.611 Note: Interest costs of $51,778 were capitalized duting 2016 continued 176 Part One State and Local Govermmente ILLUSTRATION 5-2 (Continued) Depreciation expense was charged to the functions of the primary government as follows (in thousands Governmental activities: General govemment Public safety Public works, including depreciation of infrastructure $ 21,435 11,887 60,625 Human services 1,031 Health 482 Parks and recreation 16,045 Cultural activities 30,473 Community development 86 Copital assets held by internal service funds 126 Total $142,190 Cty and Conty eof Denver, Colade Notes to the Financial Statement, Ye ended December 31, 2016, Nee D, Tables 19, 30, and 22 Ued with permission
Expert Answer:
Answer rating: 100% (QA)
Answer Explanation TOWN OF WESTON CAPITAL ASSET DISCLOSURE FOR THE YEAR ENDED APRIL 302005 Capital a... View the full answer

Related Book For 
Essentials of Accounting for Governmental and Not for Profit Organizations
ISBN: 978-1259741012
13th edition
Authors: Paul A. Copley
Posted Date:
Students also viewed these accounting questions
-
Construction Fund. During FY 2011, the voters of the Town of Dex approved constructing and equipping a recreation center to be financed by tax-supported bonds in the amount of $3,000,000. During...
-
The following changes took place last year in Herald Companys balance sheet accounts: Long-term investments that had cost the company $50 were sold during the year for $45, and land that had cost $30...
-
During fiscal year 2010, Sugar Land Doughnuts reported net loss of $129.6 million. Sugar Land received $1.7 million from the sale of other businesses. Sugar Land made capital expenditures of $10.0...
-
Question 1 As at 31 December x5 the statement of financial position of Span and Cat was as follows: Ordinary shares of RM10 each Ordinary shares of RM1 each 7% preference shares of RM1 each 5.6%...
-
Highlight the differences in the closing process when using the periodic inventory system rather than the perpetual inventory system.
-
(a) For the circuit in Fig. 4.138, obtain the Thevenin equivalent at terminals a-b. (b) Calculate the current in RL = 8(. (c) Find RL for maximum power deliverable to RL. (d) Determine that maximum...
-
Describe the consultative role of the ethics committee when addressing ethical dilemmas.
-
Gibraltar Industries is a Buffalo, New Yorkbased manufacturer of high-value-added steel products. In a recent year, it reported the following activities: Acquisitions (investments in other companies)...
-
1. How would you describe the basic components of WACC to a group of decision makers in a company? 2. On the most basic level, if a firm's WACC is 12 percent, what does this mean? 3. In calculating...
-
One-dimensional steady-state conduction, with no internal heat generation, occurs across a plane wall having a constant thermal conductivity of 30 W/m K. The material is 30 cm thick. For each case...
-
You are given the following spot rates: year 1 2 4 spot rate 1.5% 2% 2.4% 2.6% 2.8% (a) Calculate the swap rate for a 2-year deferred 5-year interest rate swap with level notional amount and...
-
Directors and officers who act in breach of their fiduciary duties owed to the corporation and its shareholders can be personally liable for their actions. Are there any circumstances under which an...
-
Why would the diversity of languages spoken by persons within the healthcare workforce create teamwork problems among healthcare staff? What language etiquette could ease interpersonal and...
-
A 6.5 kg object undergoes an acceleration of 3.6 m/s? What is the magnitude of the resultant force acting on it? If this same force is applied to a 3.9 kg object, what acceleration is produced?
-
What are the psychological underpinnings of social cohesion and collective identity, and how do factors such as intergroup conflict, prejudice, and social exclusion impact the fabric of society?
-
The coefficient of static friction between the m = 2.75-kg crate and the 35.0 incline of the figure below is 0.325. What minimum force F must be applied to the crate perpendicular to the incline to...
-
A. What are the most need in exists in schools including 1. physical building 2. school culture 3. academics 4. safety/security 5. staffing B. Develop a plan to assess how the needs in these areas...
-
Synthesize the products by drawing out reagents and intermediates along the way. `N H. OH HO HO
-
With regard to current GASB standards for other postemployment benefit reporting: 1. What are other postemployment benefits? 2. What are the reporting requirements of OPEB obligations for financial...
-
For the following transactions and events, indicate what effect each will have on the three classes of net assets using this format. Put an X in the appropriate column. If the net assets are...
-
Baird County maintains an investment trust fund for the School District and the Town of Bairdville (separate governments). Presented below is the preclosing trial balance for the investment trust...
-
The following is the trial balance of Sangeeta Udhyog Ltd. as on 31st March 2006. Further information 1.The authorised share capital of the company consists of 4,00,000 equity shares of ` 10 each. 2....
-
The accountant of Pushpa Engineering Company Ltd. has prepared the following trial balance of the company as on 31st March, 2006. Further information 1. Authorised equity share capital of the company...
-
Following trial balance as at 31st March 2006 has been prepared from the account books of Mahesh Foods Ltd. Further information 1.The authorized capital of the company is 3 lac equity shares of ` 10...

Study smarter with the SolutionInn App