

Question: Under the Base Case, what is the average implied enterprise value based using: 1. NPV 2. Value implied by comparable company analysis 3. Value implied
 Under the Base Case, what is the average implied enterprise value based using:
1. NPV
2. Value implied by comparable company analysis
3. Value implied by precedent transactions
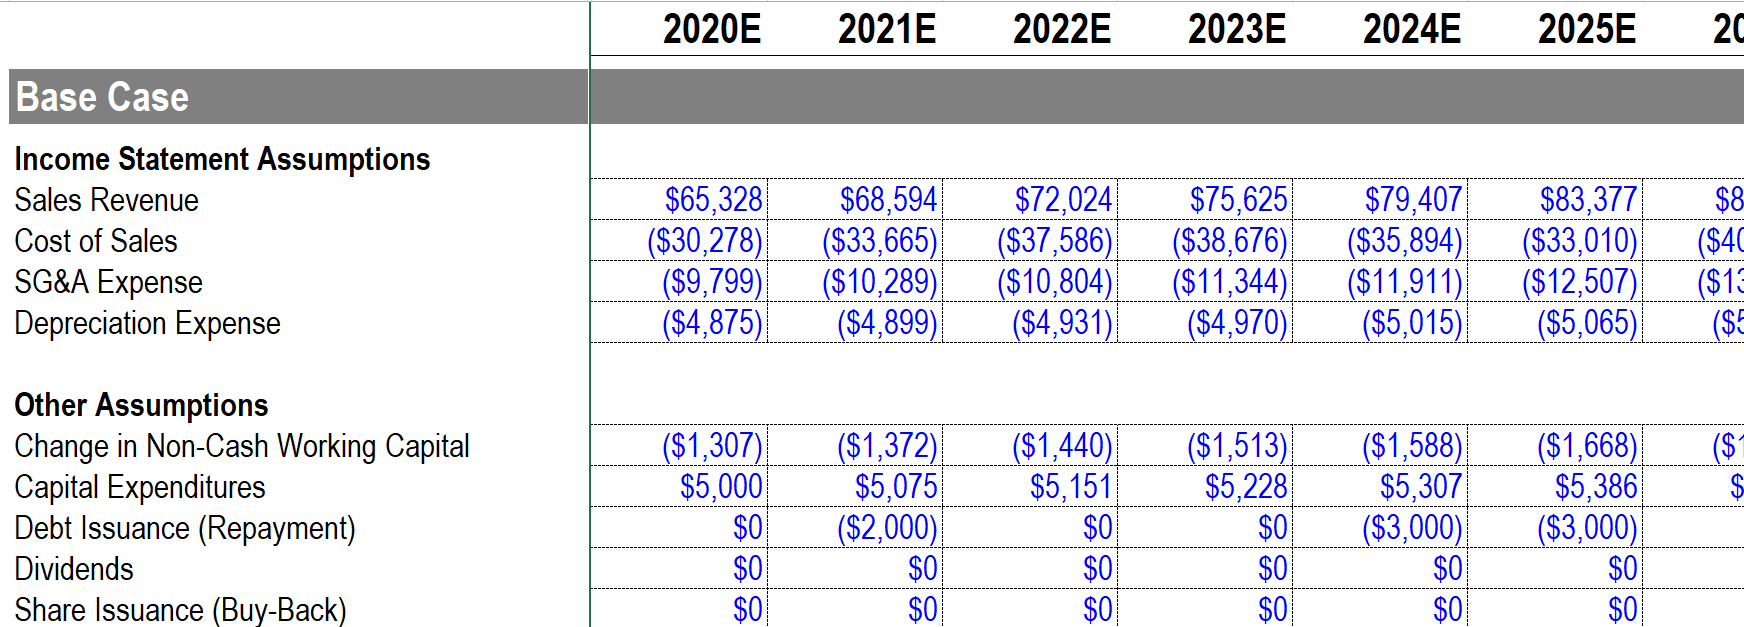
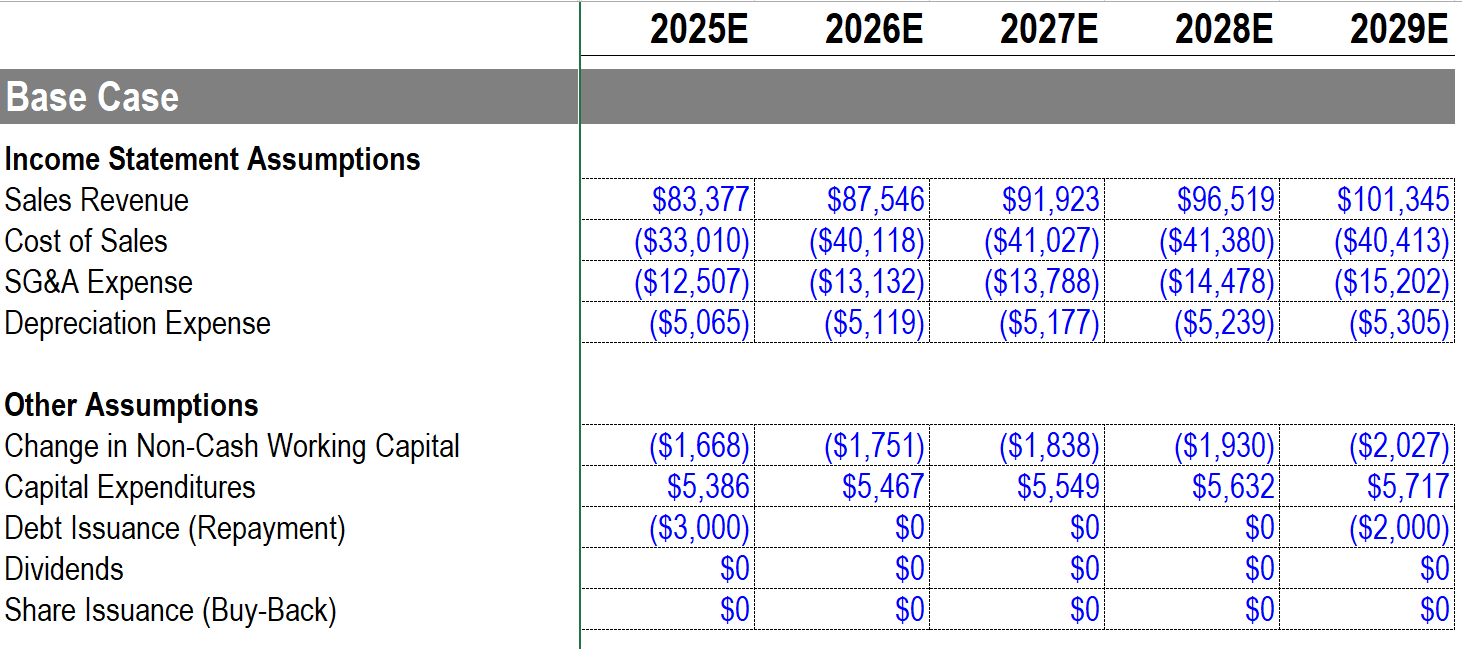
If the NPV value is given a weighting of 60%, the value implied by comparable company analysis is given a weighting of 25% and the value implied by precedent transactions a weighting of 15%. For comparable company analysis and precedent transactions, use 2021E amounts and the median EV/EBITDA. For NPV, assume the terminal value based on the perpetual growth rate assumption outlined in the assumptions sheet. $90,468; $91,071; $91,268; $91,871
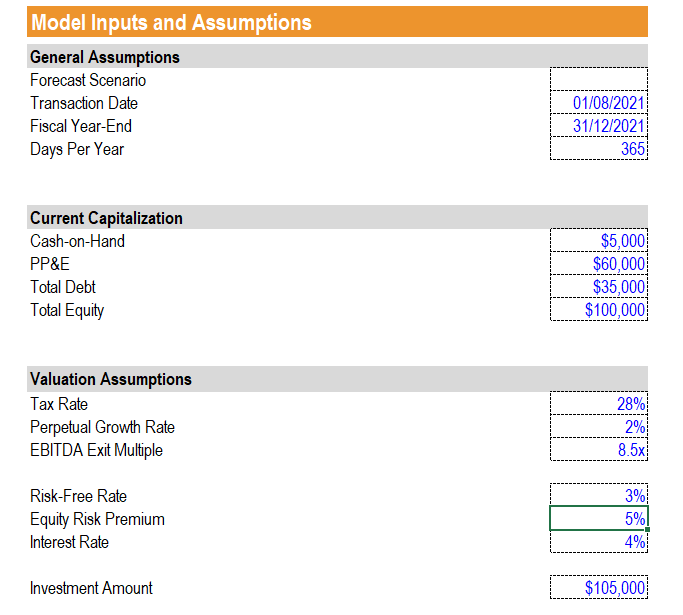
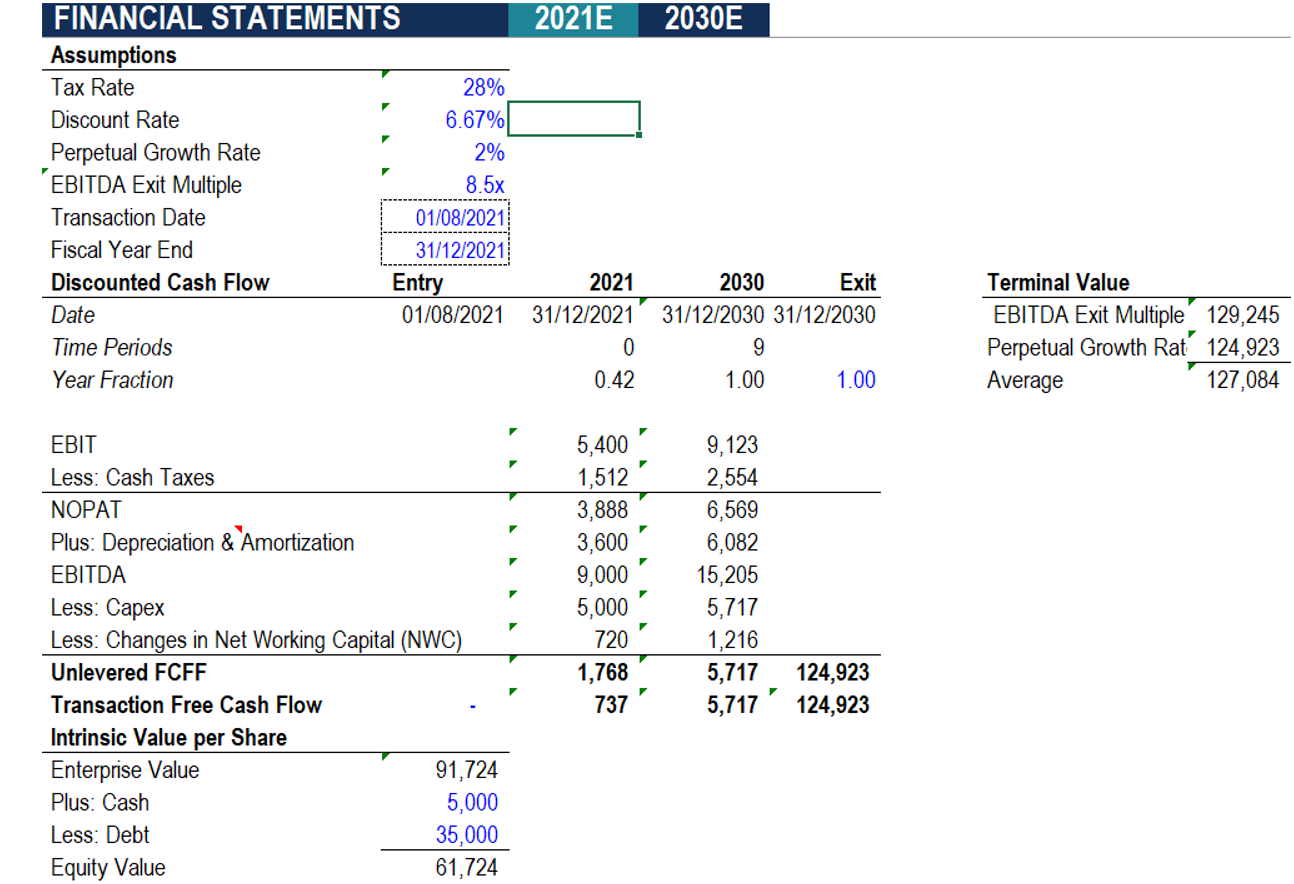
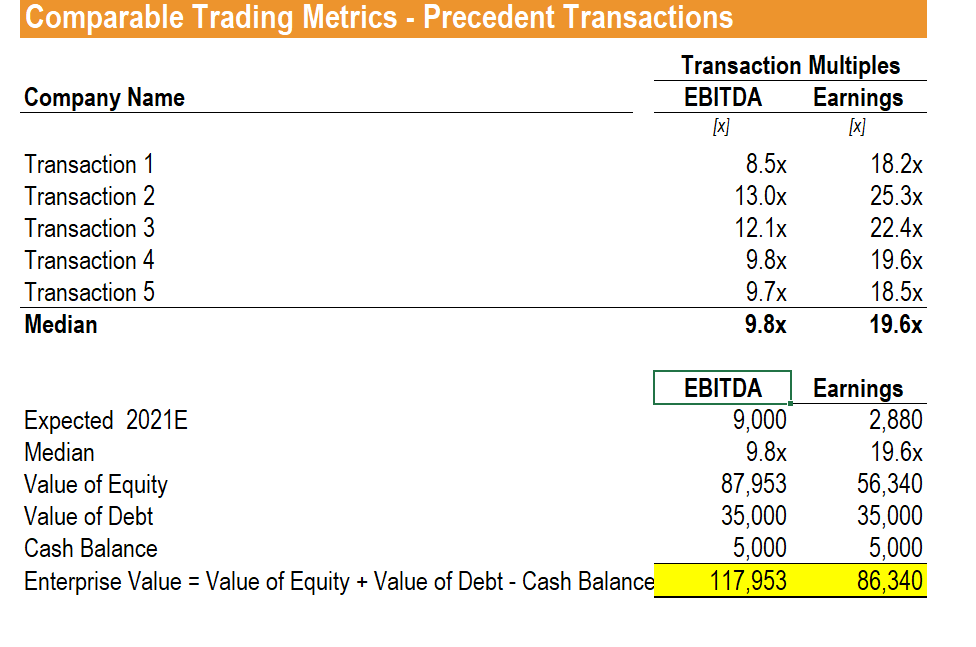
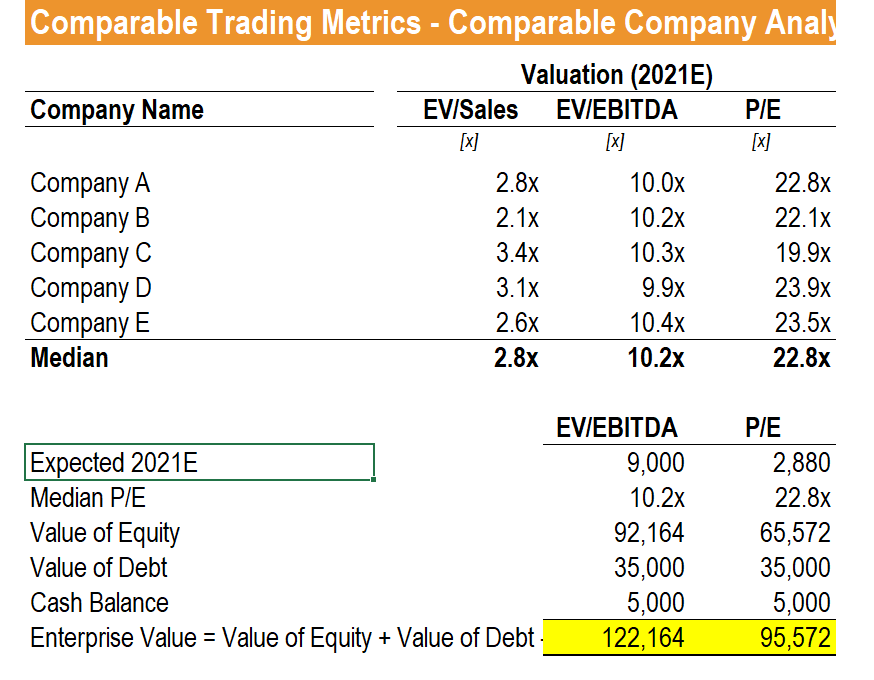
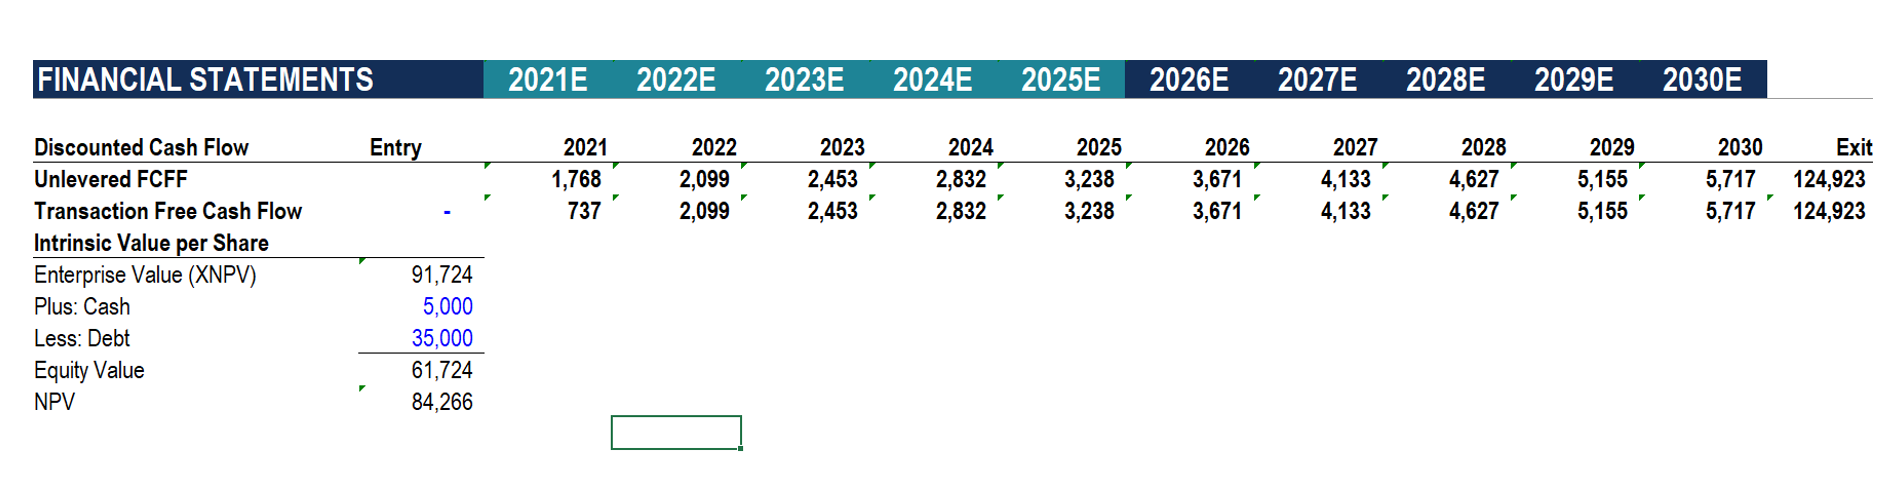
2020E 2021E 2022E 2023E 2024E 2025E 20 Base Case Income Statement Assumptions Sales Revenue Cost of Sales SG&A Expense Depreciation Expense $65,328 ($30,278) ($9,799) ($4,875) $68,594 ($33,665) ($10,289) ($4,899) $72,024 ($37,586) ($10,804) ($4,931) $75,625 ($38,676) ($11,344) ($4,970) $79,407 ($35,894) ($11,911) ($5,015) $83,377 ($33,010) ($12,507) ($5,065) $8 ($40 ($12 ($5 ($1 Other Assumptions Change in Non-Cash Working Capital Capital Expenditures Debt Issuance (Repayment) Dividends Share Issuance (Buy-Back) ($1,307) $5,000 $0 $0 $0 ($1,372) $5,075 ($2,000) $0 $0 ($1,440) $5,151 $0 $0 $0 ($1,513) $5,228 $0 $0 $0 ($1,588) $5,307 ($3,000) $0 $0 ($1,668) $5,386 ($3,000) $0 $0 2025E 2026E 2027E 2028E 2029E Base Case Income Statement Assumptions Sales Revenue Cost of Sales SG&A Expense Depreciation Expense $83,377 ($33,010) ($12,507) ($5,065) $87,546 ($40,118) ($13,132) ($5,119) $91,923 ($41,027) ($13,788) ($5,177) $96,519 ($41,380) ($14,478) ($5,239) $101,345 ($40,413) ($15,202) ($5,305) Other Assumptions Change in Non-Cash Working Capital Capital Expenditures Debt Issuance (Repayment) Dividends Share Issuance (Buy-Back) ($1,668) $5,386 ($3,000) $0 $0 ($1,751) $5,467 $0 $0 $0 ($1,838) $5,549 $0 $0 $0 ($1,930) $5,632 $0 $0 $0 ($2,027) $5,717 ($2,000) $0 $0 Model Inputs and Assumptions General Assumptions Forecast Scenario Transaction Date Fiscal Year-End Days Per Year 01/08/2021 31/12/2021 365 Current Capitalization Cash-on-Hand PP&E Total Debt $5,000 $60,000 $35,000 $100,000 Total Equity Valuation Assumptions Tax Rate Perpetual Growth Rate EBITDA Exit Multiple 28% 2% 8.5x Risk-Free Rate Equity Risk Premium Interest Rate 3% 5% 4% Investment Amount $105,000 2021E 2030E FINANCIAL STATEMENTS Assumptions Tax Rate 28% Discount Rate 6.67% Perpetual Growth Rate 2% EBITDA Exit Multiple 8.5x Transaction Date 01/08/2021 Fiscal Year End 31/12/2021 Discounted Cash Flow Entry Date 01/08/2021 Time Periods Year Fraction Exit 2021 31/12/2021 0 0.42 2030 31/12/2030 31/12/2030 9 1.00 1.00 Terminal Value EBITDA Exit Multiple' 129,245 Perpetual Growth Rat' 124,923 Average 127,084 EBIT Less: Cash Taxes NOPAT Plus: Depreciation & Amortization EBITDA Less: Capex Less: Changes in Net Working Capital (NWC) Unlevered FCFF Transaction Free Cash Flow Intrinsic Value per Share Enterprise Value 91,724 Plus: Cash 5,000 Less: Debt 35,000 Equity Value 61,724 5,400 1,512 3,888 3,600 9,000 5,000 720 1,768 737 9,123 2,554 6,569 6,082 15,205 5,717 1,216 5,717 124,923 5,717' 124,923 Comparable Trading Metrics - Precedent Transactions Transaction Multiples Company Name EBITDA Earnings [x] [x] Transaction 1 8.5x 18.2x Transaction 2 13.0x 25.3x Transaction 3 12.1x 22.4x Transaction 4 9.8x 19.6x Transaction 5 9.7x 18.5x Median 9.8x 19.6x Expected 2021E Median Value of Equity Value of Debt Cash Balance Enterprise Value = Value of Equity + Value of Debt - Cash Balance EBITDA 9,000 9.8x 87,953 35,000 5,000 117,953 Earnings 2,880 19.6x 56,340 35,000 5,000 86,340 Comparable Trading Metrics - Comparable Company Anal Valuation (20215) Company Name EV/Sales EVEBITDA P/E [x] [ [x] [x] Company A 2.8x 10.0x 22.8x Company B 2.1x 10.2x 22.1x Company C 3.4x 10.3x 19.9x Company D 3.1x 9.9x 23.9x Company E 2.6x 10.4x 23.5x Median 2.8x 10.2x 22.8x Expected 2021E Median P/E Value of Equity Value of Debt Cash Balance Enterprise Value = Value of Equity + Value of Debt: EV/EBITDA 9,000 10.2x 92,164 35,000 5,000 122,164 P/E 2,880 22.8x 65,572 35,000 5,000 95,572 FINANCIAL STATEMENTS 2021E 2022E 2023E 2024E 2025E 2026E 2027E 2028E 2029E 2030E Entry 2021 1,768 737 2022 2,099 2,099 2023 2,453 2,453 2024 2,832 2,832 2025 3,238 3,238 2026 3,671 3,671 2027 4,133 4,133 2028 4,627 4,627 2029 5,155 5,155 2030 Exit 5,717 124,923 5,717 124,923 Discounted Cash Flow Unlevered FCFF Transaction Free Cash Flow Intrinsic Value per Share Enterprise Value (XNPV) Plus: Cash Less: Debt Equity Value NPV 91,724 5,000 35,000 61,724 84,266 2020E 2021E 2022E 2023E 2024E 2025E 20 Base Case Income Statement Assumptions Sales Revenue Cost of Sales SG&A Expense Depreciation Expense $65,328 ($30,278) ($9,799) ($4,875) $68,594 ($33,665) ($10,289) ($4,899) $72,024 ($37,586) ($10,804) ($4,931) $75,625 ($38,676) ($11,344) ($4,970) $79,407 ($35,894) ($11,911) ($5,015) $83,377 ($33,010) ($12,507) ($5,065) $8 ($40 ($12 ($5 ($1 Other Assumptions Change in Non-Cash Working Capital Capital Expenditures Debt Issuance (Repayment) Dividends Share Issuance (Buy-Back) ($1,307) $5,000 $0 $0 $0 ($1,372) $5,075 ($2,000) $0 $0 ($1,440) $5,151 $0 $0 $0 ($1,513) $5,228 $0 $0 $0 ($1,588) $5,307 ($3,000) $0 $0 ($1,668) $5,386 ($3,000) $0 $0 2025E 2026E 2027E 2028E 2029E Base Case Income Statement Assumptions Sales Revenue Cost of Sales SG&A Expense Depreciation Expense $83,377 ($33,010) ($12,507) ($5,065) $87,546 ($40,118) ($13,132) ($5,119) $91,923 ($41,027) ($13,788) ($5,177) $96,519 ($41,380) ($14,478) ($5,239) $101,345 ($40,413) ($15,202) ($5,305) Other Assumptions Change in Non-Cash Working Capital Capital Expenditures Debt Issuance (Repayment) Dividends Share Issuance (Buy-Back) ($1,668) $5,386 ($3,000) $0 $0 ($1,751) $5,467 $0 $0 $0 ($1,838) $5,549 $0 $0 $0 ($1,930) $5,632 $0 $0 $0 ($2,027) $5,717 ($2,000) $0 $0 Model Inputs and Assumptions General Assumptions Forecast Scenario Transaction Date Fiscal Year-End Days Per Year 01/08/2021 31/12/2021 365 Current Capitalization Cash-on-Hand PP&E Total Debt $5,000 $60,000 $35,000 $100,000 Total Equity Valuation Assumptions Tax Rate Perpetual Growth Rate EBITDA Exit Multiple 28% 2% 8.5x Risk-Free Rate Equity Risk Premium Interest Rate 3% 5% 4% Investment Amount $105,000 2021E 2030E FINANCIAL STATEMENTS Assumptions Tax Rate 28% Discount Rate 6.67% Perpetual Growth Rate 2% EBITDA Exit Multiple 8.5x Transaction Date 01/08/2021 Fiscal Year End 31/12/2021 Discounted Cash Flow Entry Date 01/08/2021 Time Periods Year Fraction Exit 2021 31/12/2021 0 0.42 2030 31/12/2030 31/12/2030 9 1.00 1.00 Terminal Value EBITDA Exit Multiple' 129,245 Perpetual Growth Rat' 124,923 Average 127,084 EBIT Less: Cash Taxes NOPAT Plus: Depreciation & Amortization EBITDA Less: Capex Less: Changes in Net Working Capital (NWC) Unlevered FCFF Transaction Free Cash Flow Intrinsic Value per Share Enterprise Value 91,724 Plus: Cash 5,000 Less: Debt 35,000 Equity Value 61,724 5,400 1,512 3,888 3,600 9,000 5,000 720 1,768 737 9,123 2,554 6,569 6,082 15,205 5,717 1,216 5,717 124,923 5,717' 124,923 Comparable Trading Metrics - Precedent Transactions Transaction Multiples Company Name EBITDA Earnings [x] [x] Transaction 1 8.5x 18.2x Transaction 2 13.0x 25.3x Transaction 3 12.1x 22.4x Transaction 4 9.8x 19.6x Transaction 5 9.7x 18.5x Median 9.8x 19.6x Expected 2021E Median Value of Equity Value of Debt Cash Balance Enterprise Value = Value of Equity + Value of Debt - Cash Balance EBITDA 9,000 9.8x 87,953 35,000 5,000 117,953 Earnings 2,880 19.6x 56,340 35,000 5,000 86,340 Comparable Trading Metrics - Comparable Company Anal Valuation (20215) Company Name EV/Sales EVEBITDA P/E [x] [ [x] [x] Company A 2.8x 10.0x 22.8x Company B 2.1x 10.2x 22.1x Company C 3.4x 10.3x 19.9x Company D 3.1x 9.9x 23.9x Company E 2.6x 10.4x 23.5x Median 2.8x 10.2x 22.8x Expected 2021E Median P/E Value of Equity Value of Debt Cash Balance Enterprise Value = Value of Equity + Value of Debt: EV/EBITDA 9,000 10.2x 92,164 35,000 5,000 122,164 P/E 2,880 22.8x 65,572 35,000 5,000 95,572 FINANCIAL STATEMENTS 2021E 2022E 2023E 2024E 2025E 2026E 2027E 2028E 2029E 2030E Entry 2021 1,768 737 2022 2,099 2,099 2023 2,453 2,453 2024 2,832 2,832 2025 3,238 3,238 2026 3,671 3,671 2027 4,133 4,133 2028 4,627 4,627 2029 5,155 5,155 2030 Exit 5,717 124,923 5,717 124,923 Discounted Cash Flow Unlevered FCFF Transaction Free Cash Flow Intrinsic Value per Share Enterprise Value (XNPV) Plus: Cash Less: Debt Equity Value NPV 91,724 5,000 35,000 61,724 84,266
Step by Step Solution
There are 3 Steps involved in it

Get step-by-step solutions from verified subject matter experts