

Question: Instructions _ NP _ EX 1 9 _ EOM earch in Documen Insert Design Layout References Mailings Review View Century Gothic 2 2 A =
InstructionsNPEXEOM
earch in Documen
Insert
Design
Layout
References
Mailings
Review
View
Century Gothic
Af:
A
B
I
abe
A
At
II
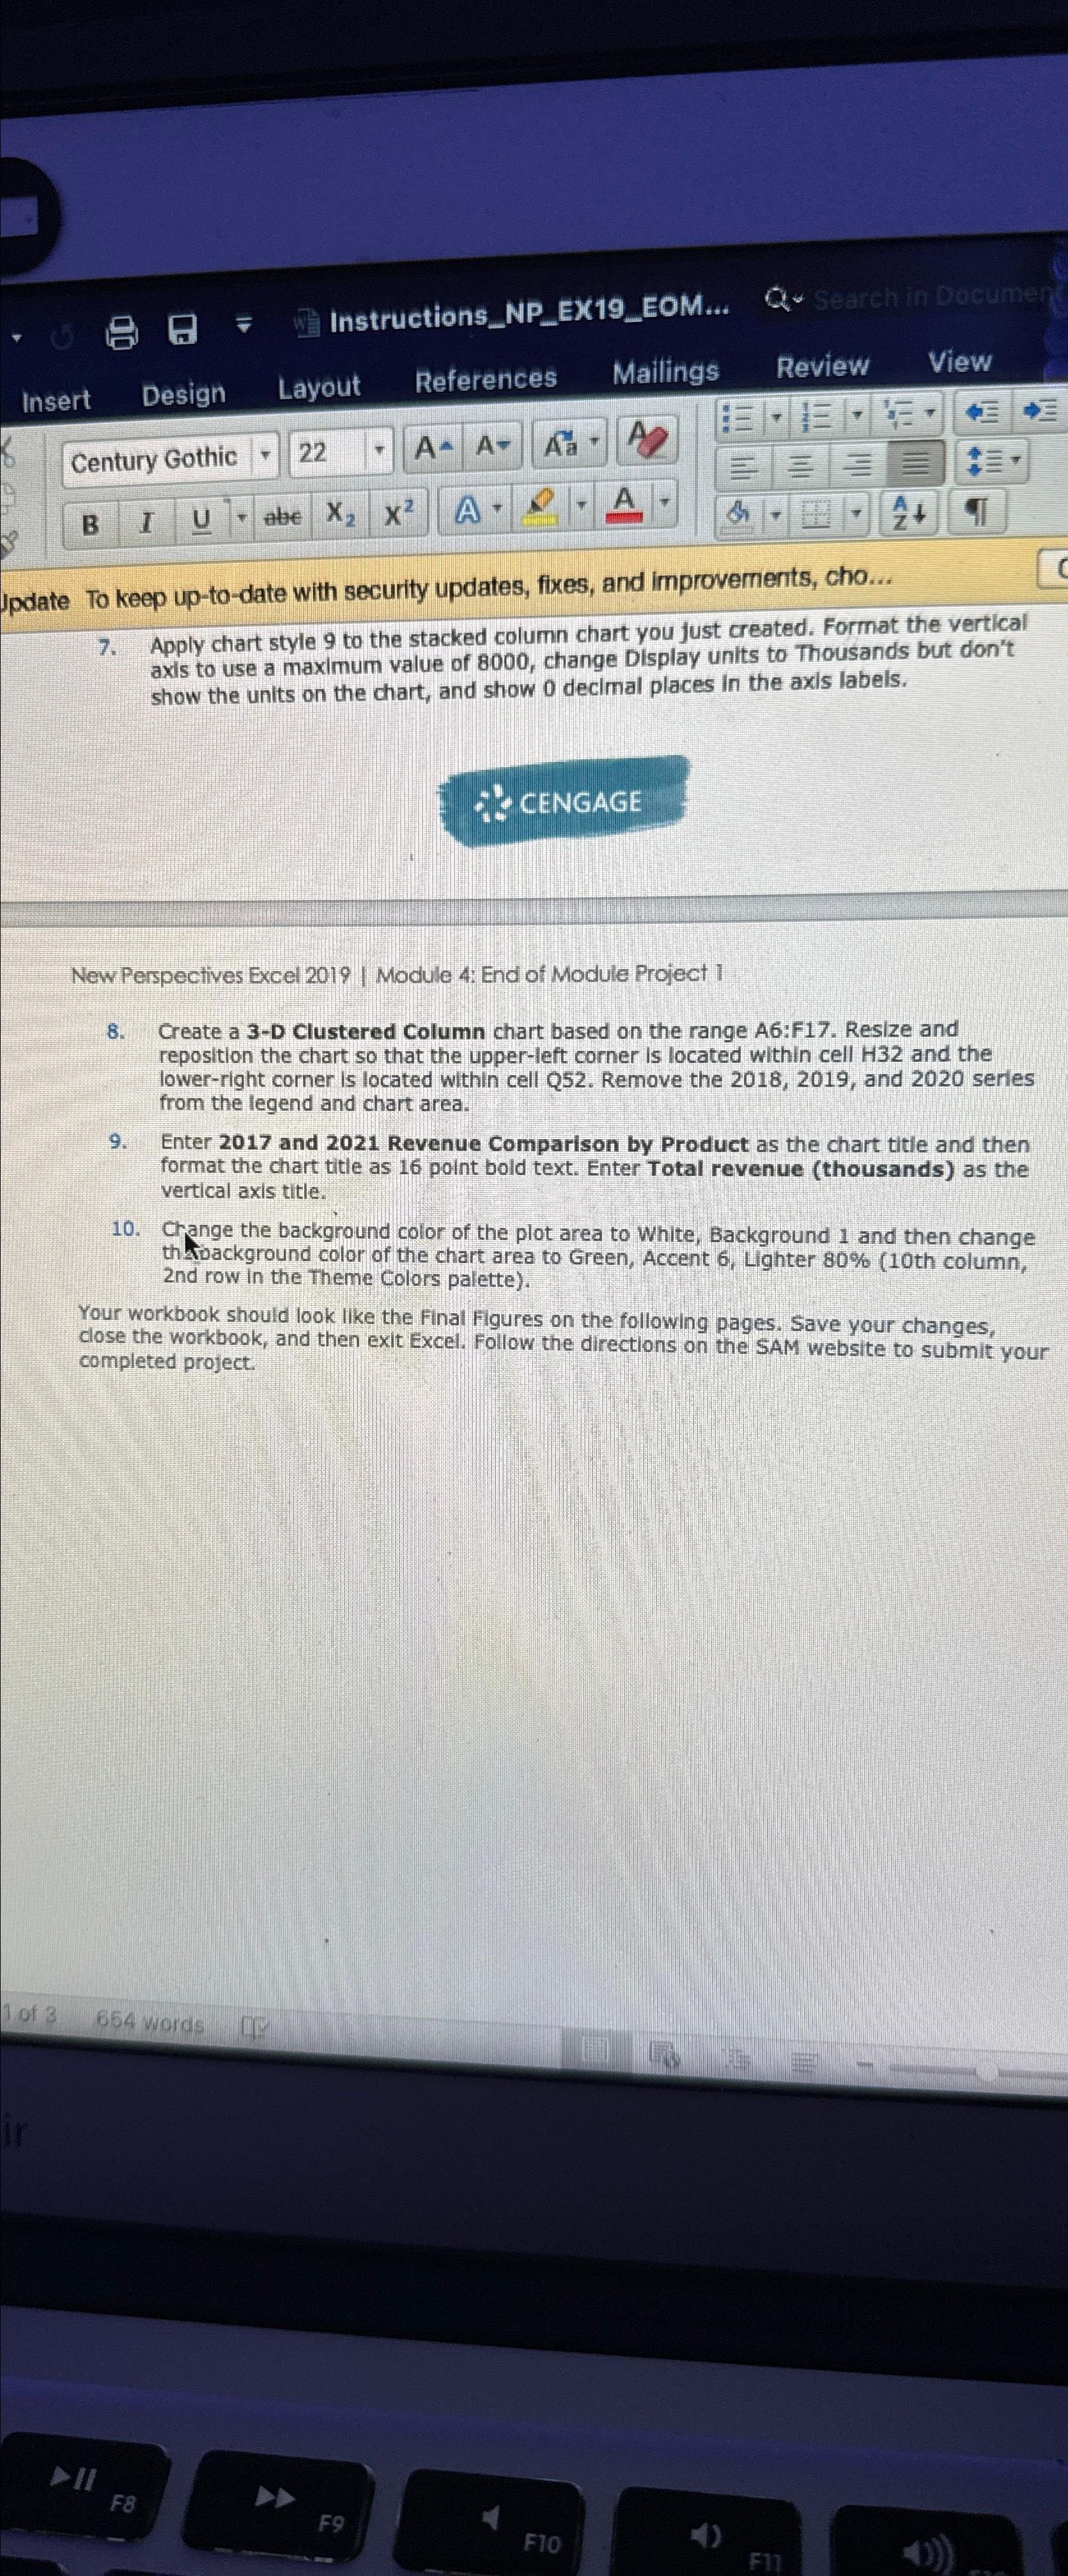
Jpdate To keep uptodate with security updates, fixes, and improvernents, cho...
Apply chart style to the stacked column chart you just created. Format the vertical axis to use a maximum value of change Display units to Thousands but don't show the units on the chart, and show decimal places in the axls labels.
New Perspectives Excel Module : End of Module Project
Create a D Clustered Column chart based on the range A:F Resize and reposition the chart so that the upperleft corner Is located within cell H and the lowerright corner is located within cell Q Remove the and series from the legend and chart area.
Enter and Revenue Comparison by Product as the chart title and then format the chart title as point bold text. Enter Total revenue thousands as the vertical axis title.
Change the background color of the plot area to White, Background and then change th toackground color of the chart area to Green, Accent Lighter th column, nd row in the Theme Colors palette
Your workbook should look like the final Figures on the following pages. Save your changes, close the workbook, and then exit Excel. Follow the directions on the SAM website to submit your completed project.
Step by Step Solution
There are 3 Steps involved in it
1 Expert Approved Answer
Step: 1 Unlock

Question Has Been Solved by an Expert!
Get step-by-step solutions from verified subject matter experts
Step: 2 Unlock
Step: 3 Unlock