

Question: INSTRUCTIONS: Open the start file, Capstone Project - Party Planning, and resave the file as: [your initials] Capstone Project - Party Planning NOTE: If the

![resave the file as: [your initials] Capstone Project - Party Planning NOTE:](https://dsd5zvtm8ll6.cloudfront.net/si.experts.images/questions/2024/10/6702614633fa5_2216702614592437.jpg)
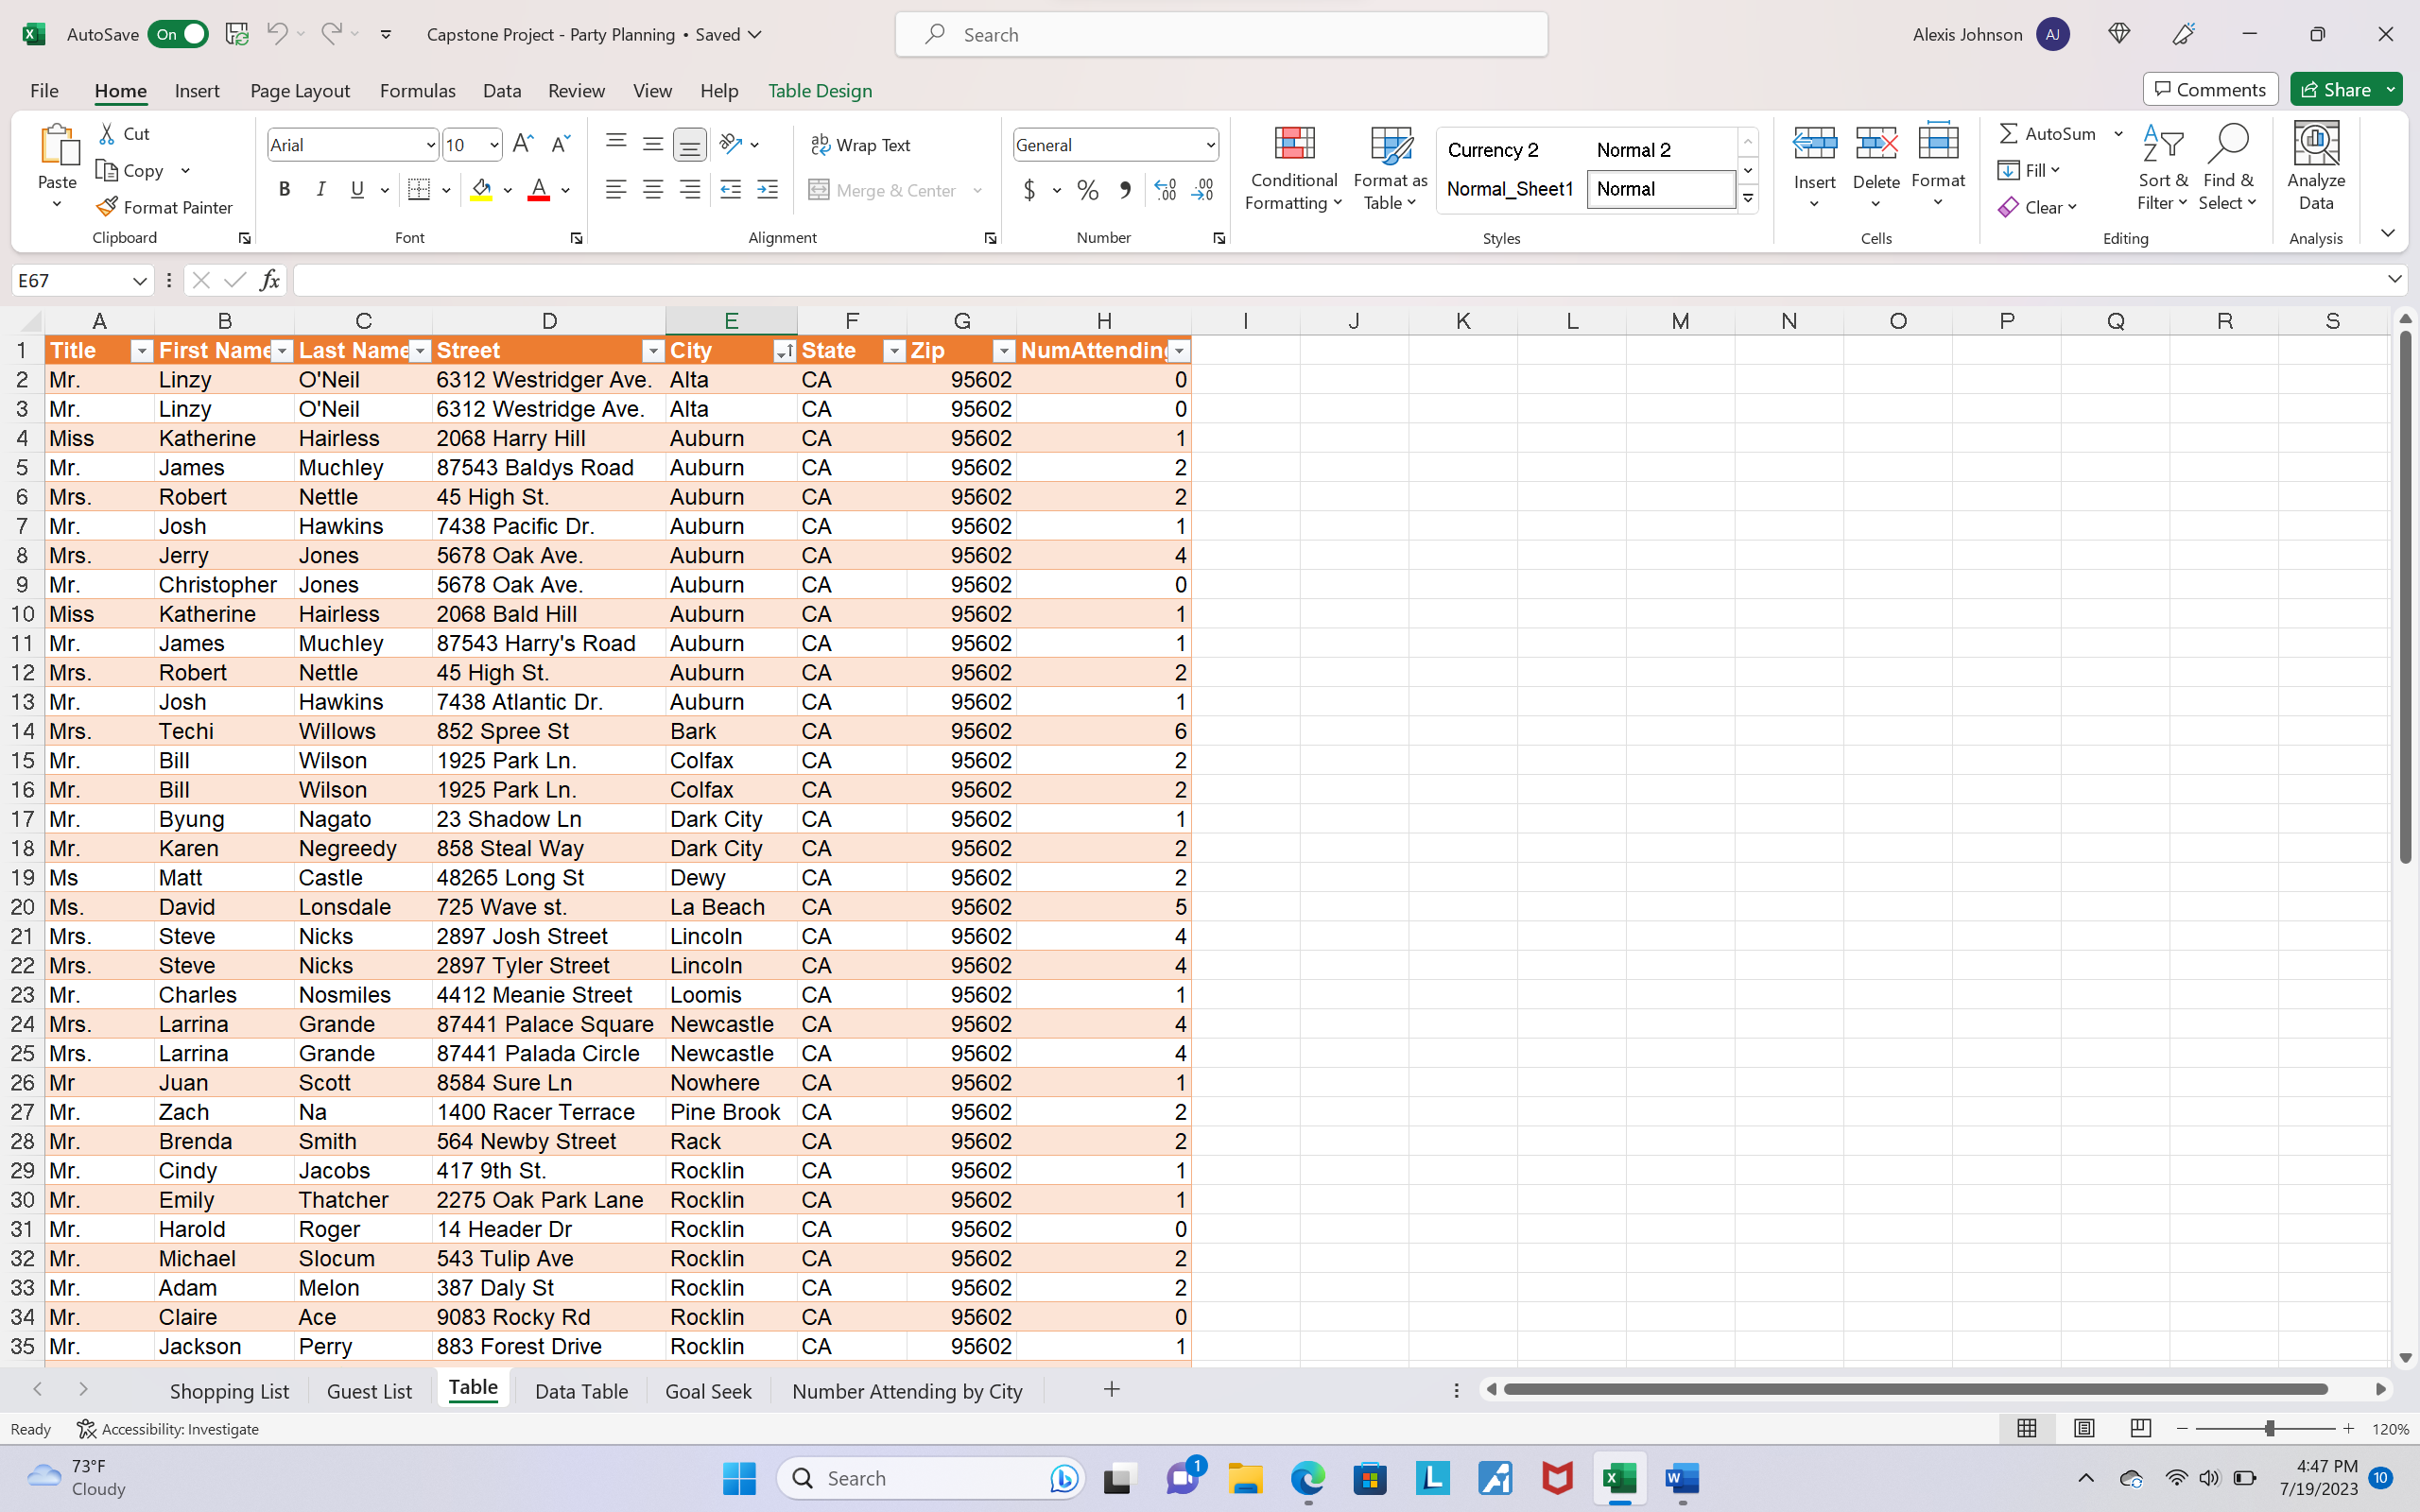
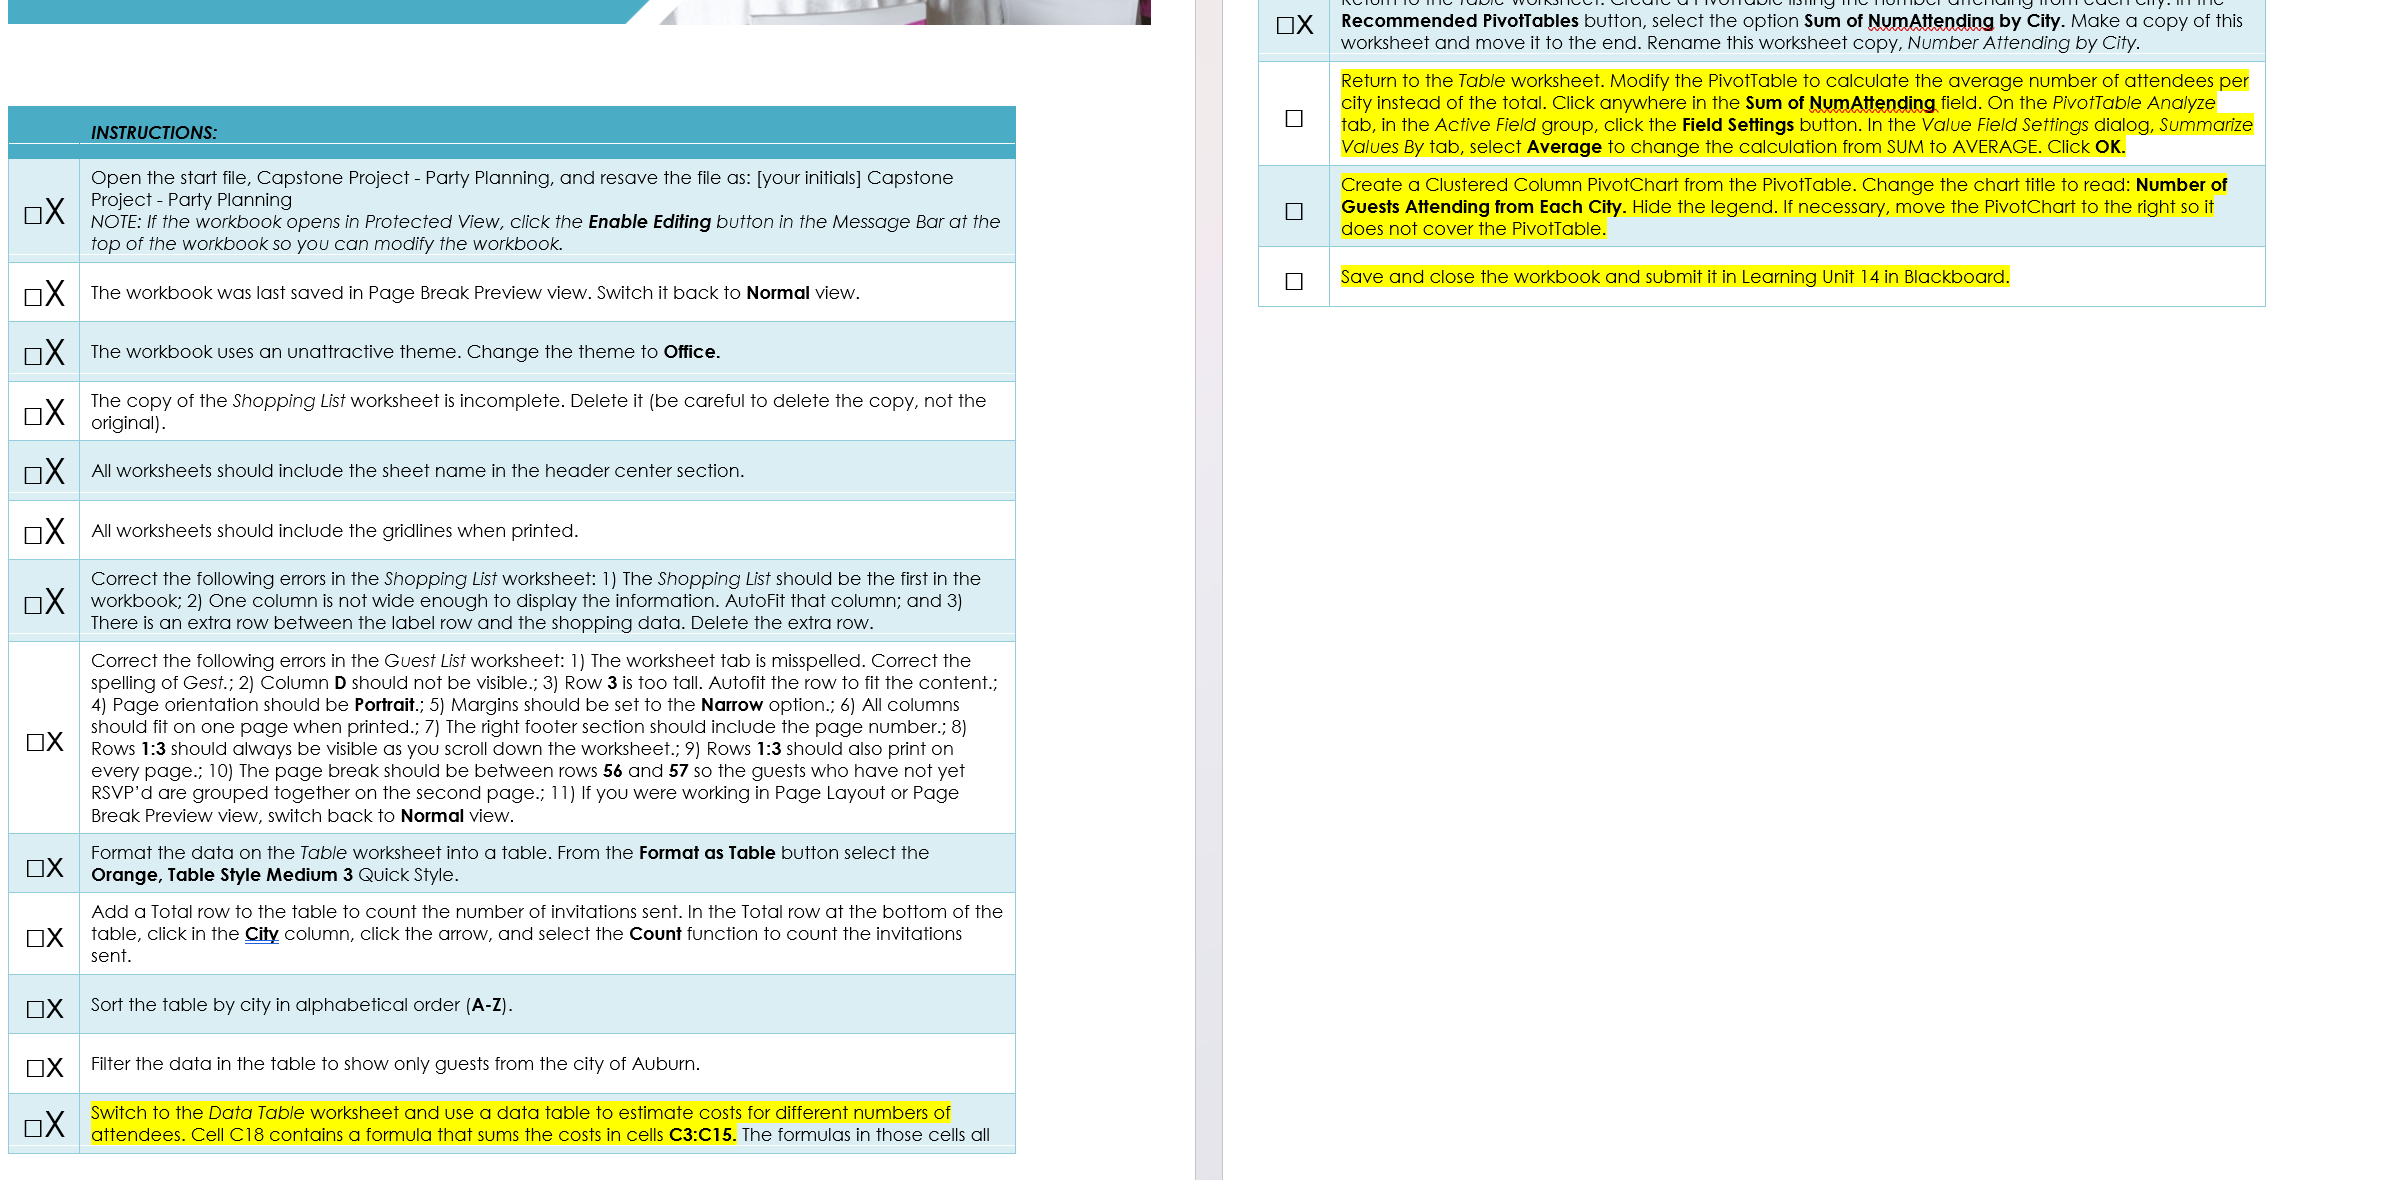
INSTRUCTIONS: Open the start file, Capstone Project - Party Planning, and resave the file as: [your initials] Capstone Project - Party Planning NOTE: If the workbook opens in Protected View, click the Enable Editing button in the Message Bar at the top of the workbook so you can modify the workbook. X The workbook was last saved in Page Break Preview view. Switch it back to Normal view. X The workbook uses an unattractive theme. Change the theme to Office. The copy of the Shopping List worksheet is incomplete. Delete it (be careful to delete the copy, not the AutoSave On L Capstone Project - Party Planning Saved Search Alexis Johnson File Home Insert Page Layout Formulas Data Review View Help Table Design X Recommended PivotTables button, select the option Sum of NumAttending by City. Make a copy of this worksheet and move it to the end. Rename this worksheet copy, Number Attending by City. Return to the Table worksheet. Modify the PivotTable to calculate the average number of attendees per city instead of the total. Click anywhere in the Sum of NumAttending field. On the PivotTable Analyze tab, in the Active Field group, click the Field Settings button. In the Value Field Settings dialog, Summarize Values By tab, select Average to change the calculation from SUM to AVERAGE. Click OK. Create a Clustered Column PivotChart from the PivotTable. Change the chart title to read: Number of Guests Attending from Each City. Hide the legend. If necessary, move the PivotChart to the right so it does not cover the PivotTable. Save and close the workbook and submit it in Learning Unit 14 in Blackboard. AutoSave On L Capstone Project - Party Planning Saved Search Alexis Johnson File Home Insert Page Layout Formulas Data Review View Help Table Design INSTRUCTIONS: Open the start file, Capstone Project - Party Planning, and resave the file as: [your initials] Capstone Project - Party Planning NOTE: If the workbook opens in Protected View, click the Enable Editing button in the Message Bar at the top of the workbook so you can modify the workbook. X The workbook was last saved in Page Break Preview view. Switch it back to Normal view. X The workbook uses an unattractive theme. Change the theme to Office. The copy of the Shopping List worksheet is incomplete. Delete it (be careful to delete the copy, not the AutoSave On L Capstone Project - Party Planning Saved Search Alexis Johnson File Home Insert Page Layout Formulas Data Review View Help Table Design X Recommended PivotTables button, select the option Sum of NumAttending by City. Make a copy of this worksheet and move it to the end. Rename this worksheet copy, Number Attending by City. Return to the Table worksheet. Modify the PivotTable to calculate the average number of attendees per city instead of the total. Click anywhere in the Sum of NumAttending field. On the PivotTable Analyze tab, in the Active Field group, click the Field Settings button. In the Value Field Settings dialog, Summarize Values By tab, select Average to change the calculation from SUM to AVERAGE. Click OK. Create a Clustered Column PivotChart from the PivotTable. Change the chart title to read: Number of Guests Attending from Each City. Hide the legend. If necessary, move the PivotChart to the right so it does not cover the PivotTable. Save and close the workbook and submit it in Learning Unit 14 in Blackboard. AutoSave On L Capstone Project - Party Planning Saved Search Alexis Johnson File Home Insert Page Layout Formulas Data Review View Help Table Design
Step by Step Solution
There are 3 Steps involved in it

Get step-by-step solutions from verified subject matter experts