Question: Instructions Utilizing Exhibit 7.3.7.4, and 7.5 (Harrison, pp. 182-185): . Based on the three financial statements, what conclusions can you draw? What might be an
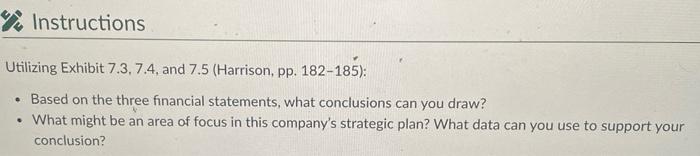
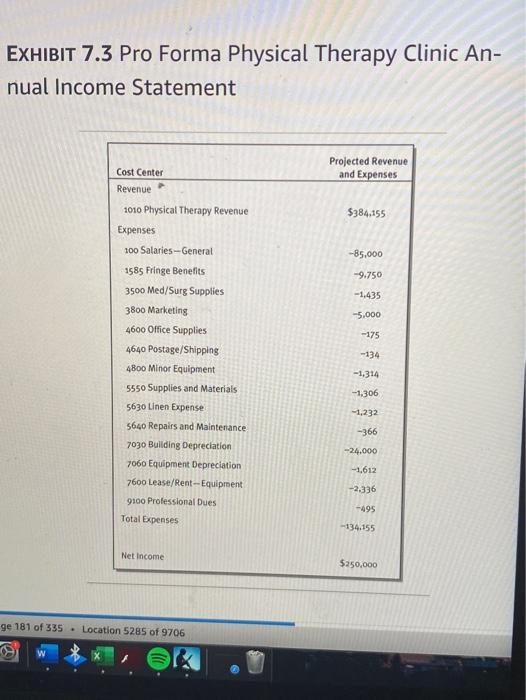
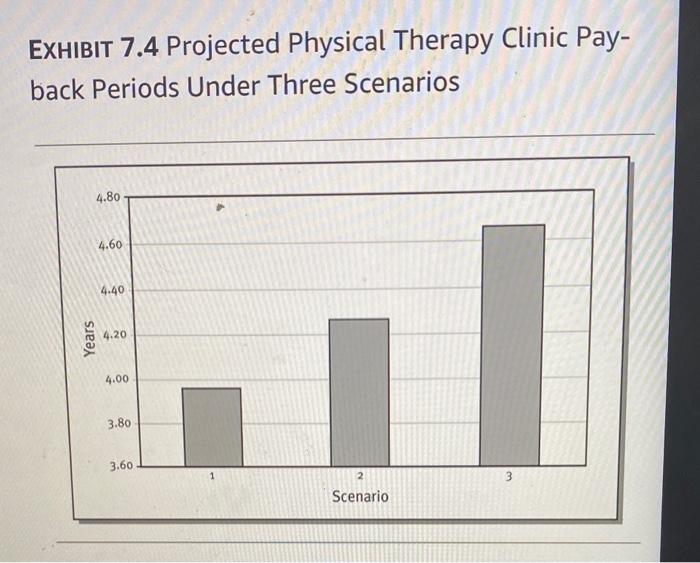
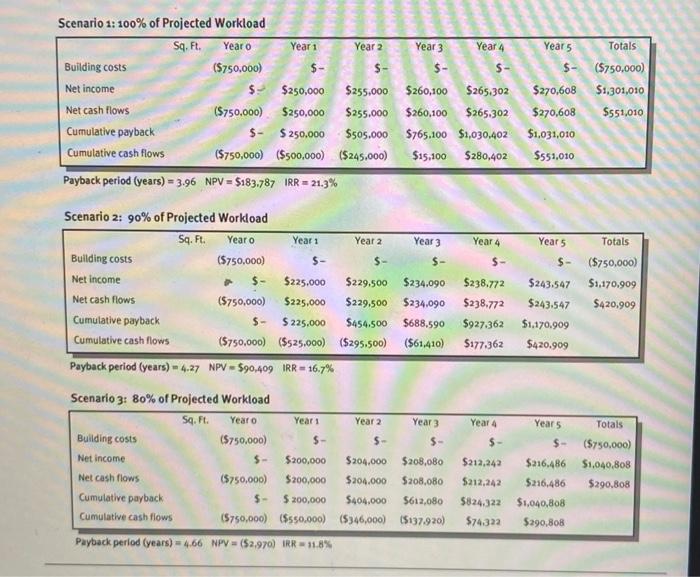
Instructions Utilizing Exhibit 7.3.7.4, and 7.5 (Harrison, pp. 182-185): . Based on the three financial statements, what conclusions can you draw? What might be an area of focus in this company's strategic plan? What data can you use to support your conclusion? . EXHIBIT 7.3 Pro Forma Physical Therapy Clinic An- nual Income Statement Cost Center Revenue Projected Revenue and Expenses $384.155 -85,000 -9.750 -1,435 -5,000 -175 1010 Physical Therapy Revenue Expenses 100 Salaries - General 1585 Fringe Benefits 3500 Med/Surg Supplies 3800 Marketing 4600 Office Supplies 4640 Postage/Shipping 4800 Minor Equipment 5550 Supplies and Materials 5630 Linen Expense 5640 Repairs and Maintenance 7030 Building Depreciation 7060 Equipment Depreciation 7600 Lease/Rent --Equipment 9100 Professional Dues Total Expenses -1,314 -1,306 -1,232 -366 -24.000 -1.612 -2.336 -495 -134.155 Net Income $250,000 ge 181 of 335 . Location 5285 of 9706 EXHIBIT 7.4 Projected Physical Therapy Clinic Pay- back Periods Under Three Scenarios 4.80 4.60 4.40 Years 4.20 4.00 3.80 3.60 3 Scenario Year 3 Scenario 1: 100% of Projected Workload Sq. Ft. Year o Year 1 Year 2 Year 4 Year 5 Totals Building costs (5750.000) $- $- $- ($750,000) Net income $- $250,000 $255.000 $260,100 $265.302 $270,608 $1,301,010 Net cash flows (5750.000) $250,000 $255,000 $260,100 $265,302 $270,608 $551,010 Cumulative payback $- $ 250.000 $505.000 $765,100 $1,030,402 $1,031,010 Cumulative cash flows ($750,000) ($500,000) ($245,000) $15,100 $280,402 $551,010 Payback period (years) = 3.96 NPV = $183,787 IRR = 21.3% Year: Year 4 Year 5 $- Scenario 2: 90% of Projected Workload Sq. Ft. Year o Year 2 Year 3 Building costs (5750,000) $- $- $- Net income $225.000 $229,500 $234.090 Net cash flows (5750,000) $225.000 $229,500 $234.090 Cumulative payback $- $225,000 $454.500 $688.590 Cumulative cash flows (5750,000) ($525.000) ($295.500) ($61,410) Payback period (years) - 4.27 NPV - 590,409 IRR - 16.7% Totals ($750,000) $1,170,909 $420,909 $238.772 $238.772 $927.362 $177.362 $243.547 $243.547 $1.170.909 $420,909 Year 4 Years Scenario 3: 80% of Projected Workload Sq. Ft. Year o Year 1 Year 2 Year 3 Building costs ($750,000) $- $- $- Net income $- $200,000 $204.000 $208,080 Net cash flows (5750,000) $200,000 $204.000 $208,080 Cumulative payback $- $ 200,000 $404.000 $612,080 Cumulative cash flows (5750,000) ($550.000) (5346,000) $137.920) Payback period (years) = 4.66 NPV = (52.970) IRR = 11.8% $212,242 $212,242 5824.322 574322 Totals $- ($750,000) $216,486 51,040,808 $216.486 $290.808 $1,040,808 $290,808