

Question: Instructions: - You should submit your answer as a Jupiter Notebook file only. Submit only the .ipynb file that should contain all your answers for
Instructions:
- You should submit your answer as a Jupiter Notebook file only. Submit only the .ipynb file that should contain all your answers for this assignment.
- This is an individual assignment. Any two identical answers will be graded ZERO automatically.
- Assignments submitted after due date will NOT be accepted.
Date Set Description:
We'll be using the "mammographic masses" public dataset from the UCI repository. This data contains 961 instances of masses detected in mammograms, and contains the following attributes:
1. BI-RADS assessment: 1 to 5 (ordinal)
2. Age: patient's age in years (integer)
3. Shape: mass shape: round=1 oval=2 lobular=3 irregular=4 (nominal)
4. Margin: mass margin: circumscribed=1 microlobulated=2 obscured=3 ill-defined=4 spiculated=5 (nominal)
5. Density: mass density high=1 iso=2 low=3 fat-containing=4 (ordinal)
6. Severity: benign=0 or malignant=1 (binominal) (The dependent variable)
BI-RADS is an assessment of how confident the severity classification is; it is not a "predictive" attribute and so we will discard it. The age, shape, margin, and density attributes are the features that we will build our model with, and "severity" is the classification we will attempt to predict based on those attributes.
Although "shape" and "margin" are nominal data types, which sklearn typically doesn't deal with well, they are close enough to ordinal that we shouldn't just discard them. The "shape" for example is ordered increasingly from round to irregular.
Note: You may use pandas, numpy, sklearn or any essential python package you need.
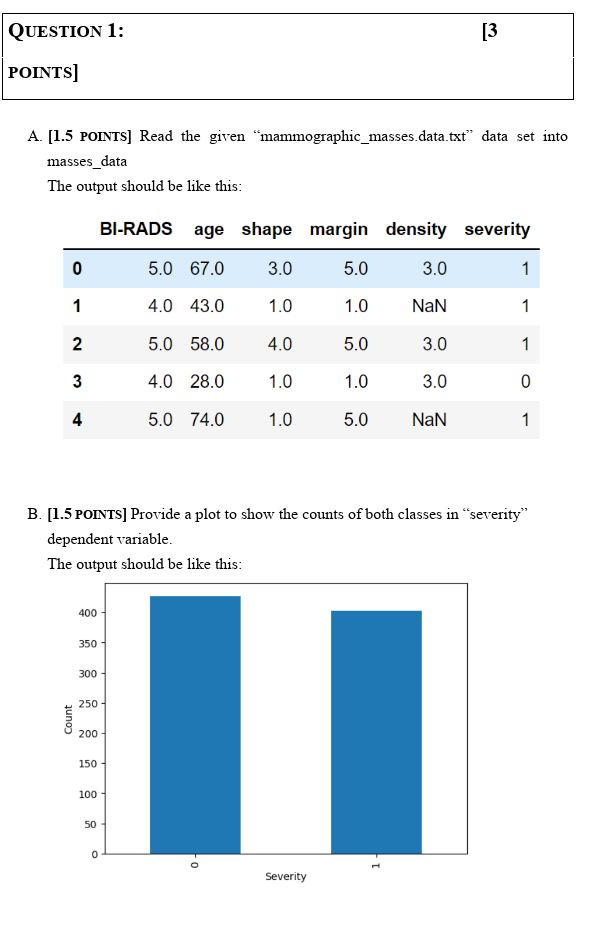
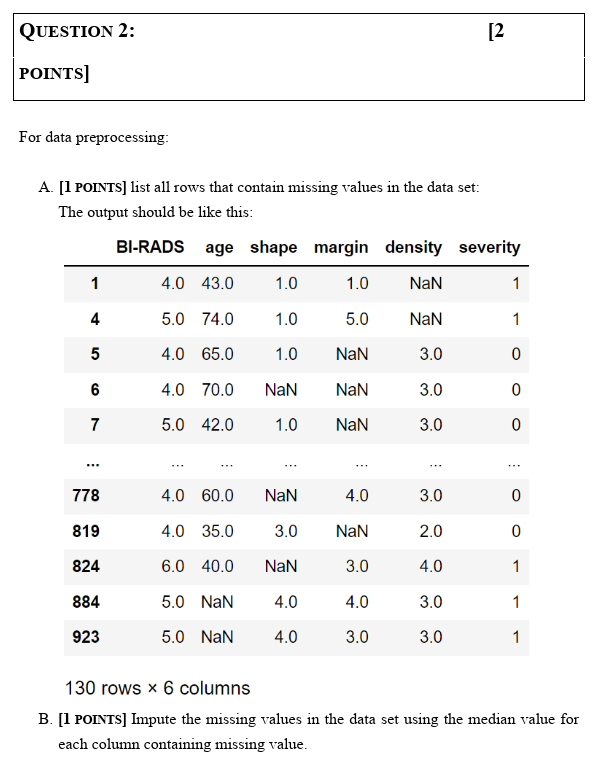
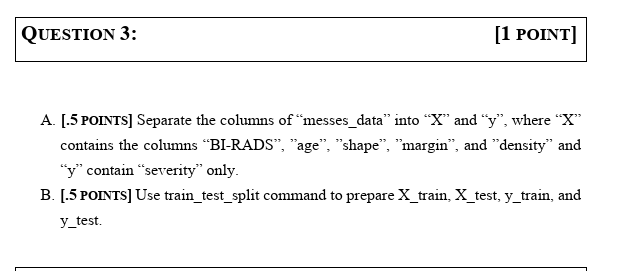
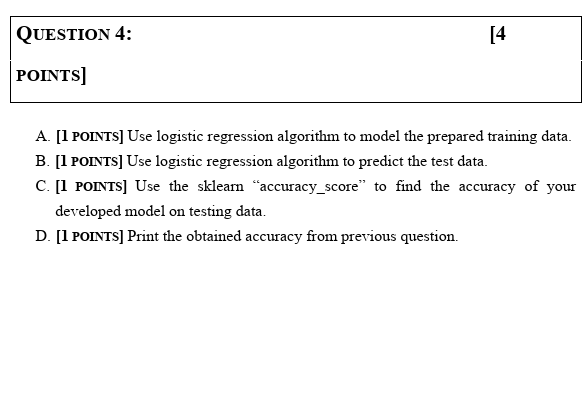
A. [1.5 PoINTS] Read the given "mammographic_masses.data.txt" data set into masses_data The output should be like this: B. [1.5 POINTS] Provide a plot to show the counts of both classes in "severity" dependent variable. The output should be like this: For data preprocessing: A. [1 POINTS] list all rows that contain missing values in the data set: The nutnut should he like thic. 130 rows 6 columns B. [1 POINTS] Impute the missing values in the data set using the median value for each column containing missing value. A. [.5 Points] Separate the columns of "messes_data" into " X " and " y ", where " X " contains the columns "BI-RADS", "age", "shape", "margin", and "density" and " y " contain "severity" only. B. [.5 PoINTS] Use train_test_split command to prepare Xtrain, Xtest, ytrain, and \( y_{\text {_test. }} \) A. [1 PoINTS] Use logistic regression algorithm to model the prepared training data. B. [1 PoINTS] Use logistic regression algorithm to predict the test data. C. [1 POINTS] Use the sklearn "accuracy_score" to find the accuracy of your developed model on testing data. D. [1 PoINTS] Print the obtained accuracy from previous
Step by Step Solution
There are 3 Steps involved in it

Get step-by-step solutions from verified subject matter experts