Question: Integrative Cases 14-69. Barrows Consumer Products (A) ( LO 14 1, 2 2, 2 3, 2 4) I thought evaluating performance would be easier than
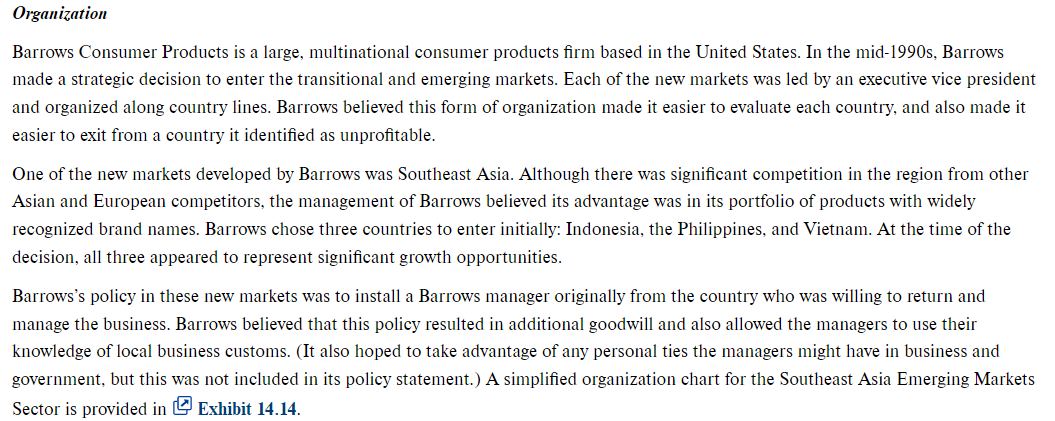
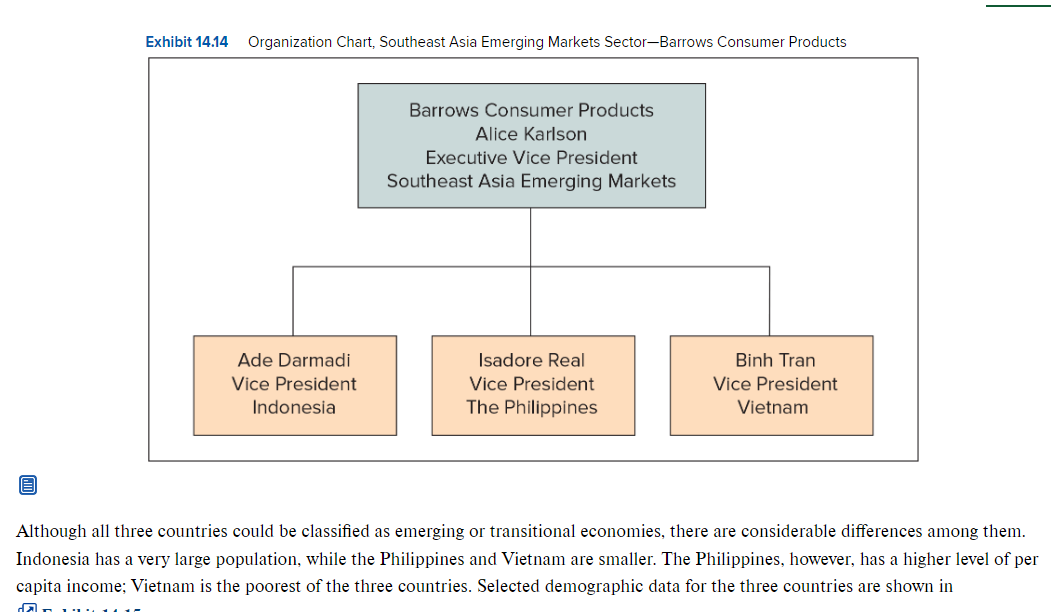
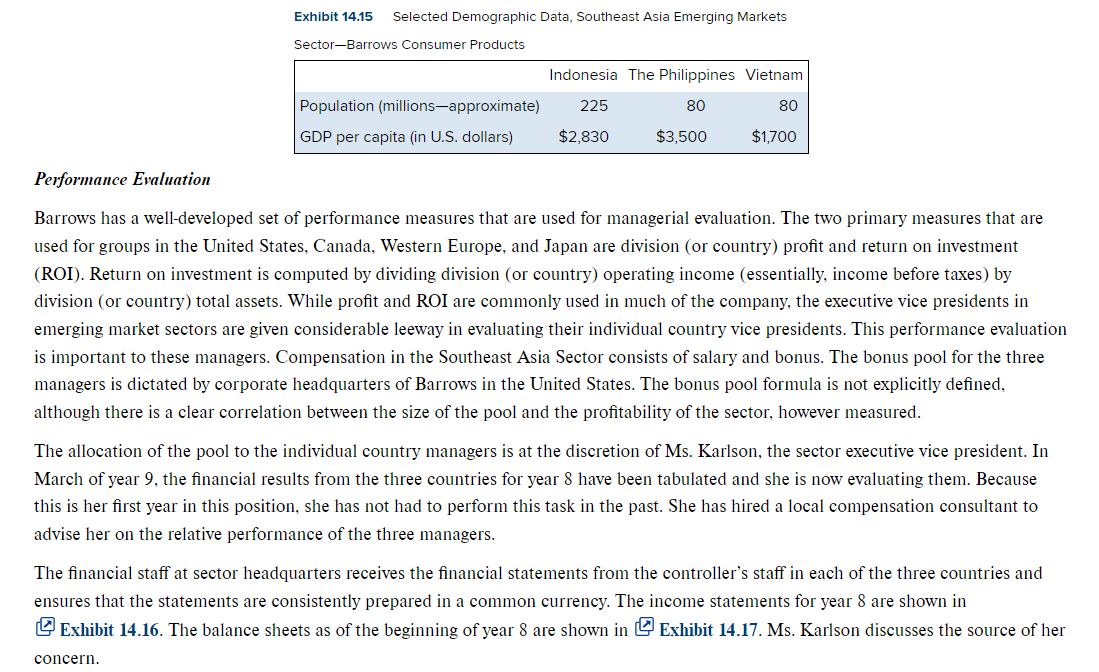
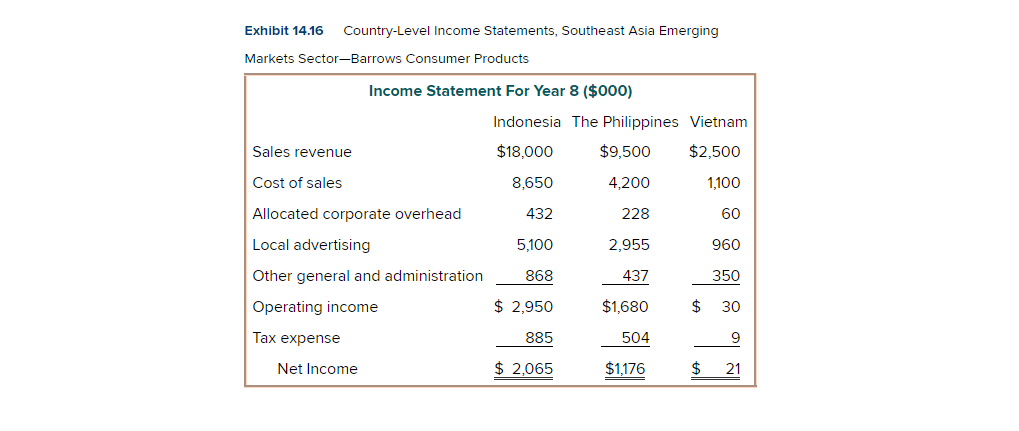
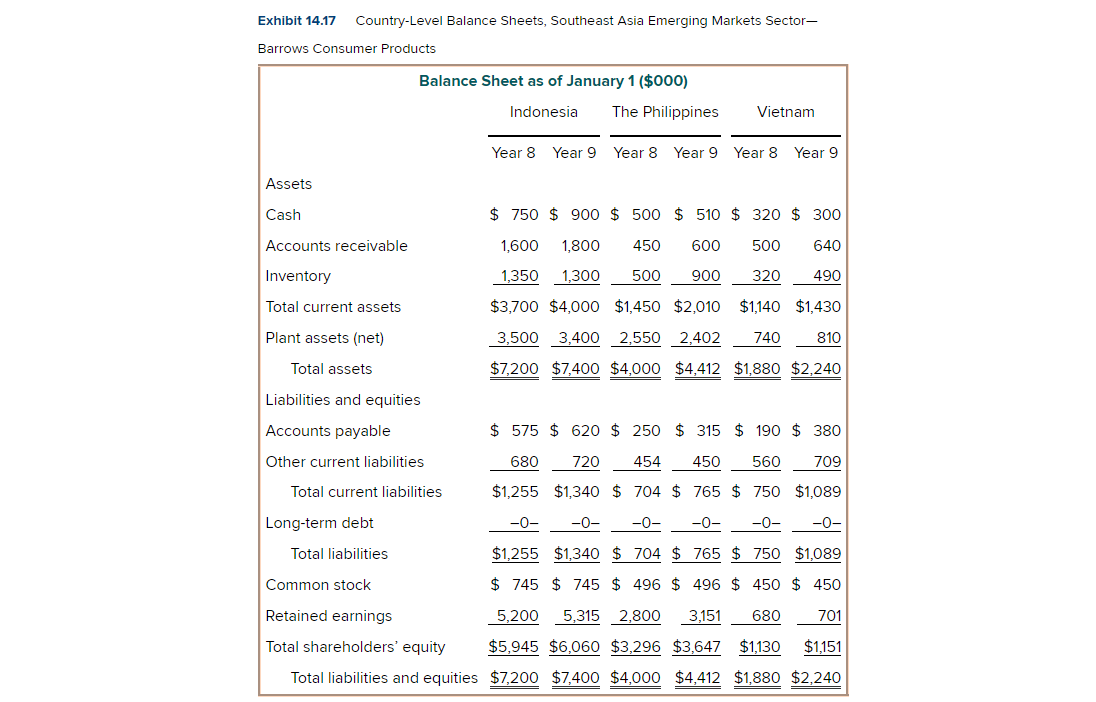
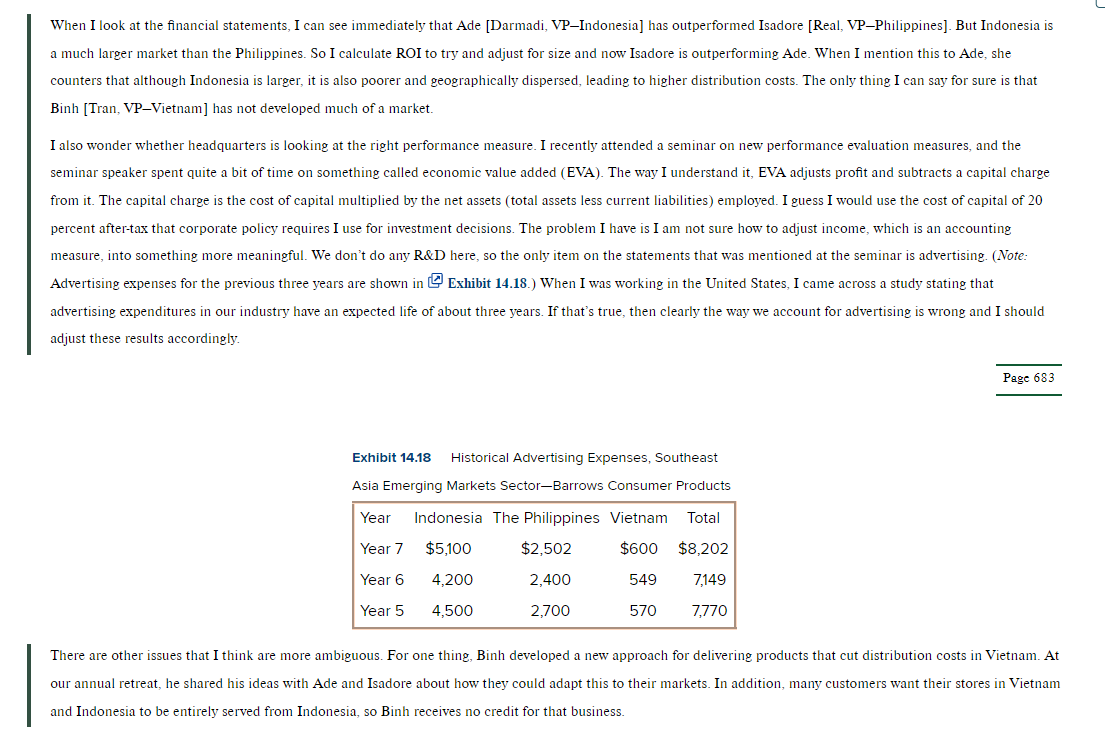
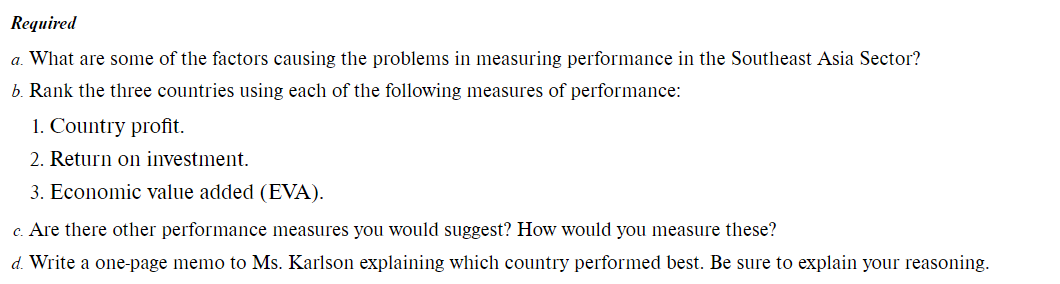
Integrative Cases 14-69. Barrows Consumer Products (A) ( LO 14 1, 2 2, 2 3, 2 4) I thought evaluating performance would be easier than this. I have three vice presidents, operating the same business in three different countries. I need to be able to compare them in order to prepare compensation recommendations to the board. The problem is that there are so many variables that each of the managers can make some claim to having the best performance. I hope our consultant can help me sort this out. Alice Karlson, Executive Vice President Southeast Asia Emerging Markets Sector Barrows Consumer ProductsOrganization Barrows Consumer Products is a large, multinational consumer products rm based in the United States. In the mid1990s. Barrows made a strategic decision to enter the transitional and emerging markets. Each ofthe new markets was led by an executive vice president and organized along country lines. Barrows believed this form of organization made it easier to evaluate each country. and also made it easier to exit from a country it identied as unprotable. One ofthe new markets developed by Barrows was Southeast Asia. Although there was signicant competition in the region from other Asian and European competitors, the management of Barrows believed its advantage was in its portfolio of products with wider recognized brand names. Barrows chose three countries to enter initially: Indonesia. the Philippines. and Vietnam. At the time ofthe decision, all three appeared to represent signicant growth opportunities. Barrows's policy in these new markets was to install a Barrows manager originally from the country who was willing to return and manage the business. Barrows believed that this policy resulted in additional goodwill and also allowed the managers to use their knowledge of local business customs. (It also hoped to take advantage of any personal ties the managers might have in business and government. but this was not included in its policy statement.) A simplied organization chart for the Southeast Asia Emerging Markets Sector is provided in Exhibit 14.14. Exhibit 14.14 Organization Chart, Southeast Asia Emerging Markets Sector-Barrows Consumer Products Barrows Consumer Products Alice Karlson Executive Vice President Southeast Asia Emerging Markets Ade Darmadi Isadore Real Binh Tran Vice President Vice President Vice President Indonesia The Philippines Vietnam Although all three countries could be classified as emerging or transitional economies, there are considerable differences among them. Indonesia has a very large population, while the Philippines and Vietnam are smaller. The Philippines, however, has a higher level of per capita income; Vietnam is the poorest of the three countries. Selected demographic data for the three countries are shown inExhibit 14.15 Selected Demographic Data, Southeast Asia Emerging Markets Sector-Barrows Consumer Products Indonesia The Philippines Vietnam Population (millions-approximate) 225 80 80 GDP per capita (in U.S. dollars) $2,830 $3,500 $1,700 Performance Evaluation Barrows has a well-developed set of performance measures that are used for managerial evaluation. The two primary measures that are used for groups in the United States, Canada, Western Europe, and Japan are division (or country) profit and return on investment (ROI). Return on investment is computed by dividing division (or country) operating income (essentially, income before taxes) by division (or country) total assets. While profit and ROI are commonly used in much of the company, the executive vice presidents in emerging market sectors are given considerable leeway in evaluating their individual country vice presidents. This performance evaluation is important to these managers. Compensation in the Southeast Asia Sector consists of salary and bonus. The bonus pool for the three managers is dictated by corporate headquarters of Barrows in the United States. The bonus pool formula is not explicitly defined, although there is a clear correlation between the size of the pool and the profitability of the sector, however measured. The allocation of the pool to the individual country managers is at the discretion of Ms. Karlson, the sector executive vice president. In March of year 9, the financial results from the three countries for year 8 have been tabulated and she is now evaluating them. Because this is her first year in this position, she has not had to perform this task in the past. She has hired a local compensation consultant to advise her on the relative performance of the three managers. The financial staff at sector headquarters receives the financial statements from the controller's staff in each of the three countries and ensures that the statements are consistently prepared in a common currency. The income statements for year 8 are shown in L Exhibit 14.16. The balance sheets as of the beginning of year 8 are shown in L Exhibit 14.17. Ms. Karlson discusses the source of her concern.Exhibit 14.16 CountryLevel Income Statements. Southeast Asia Emerging Markets SectorBarrows Consumer Products Income Statement For Year 8 [$000]: Indonesia The Philippines Vietnam Sales revenue $18,000 $9,500 $2,500 Cost of sales 8,650 4,200 1,100 Allocated corporate overhead 432 228 Local advertising 5,100 2,955 Other general and administration 868 437 Operating income $ 2,950 $1,680 Tax expense 885 504 Net Income $ 2.065 $1,176 Exhibit 14.17 Country-Level Balance Sheets, Southeast Asia Emerging Markets Sector- Barrows Consumer Products Balance Sheet as of January 1 ($000) Indonesia The Philippines Vietnam Year 8 Year 9 Year 8 Year 9 Year 8 Year 9 Assets Cash $ 750 $ 900 $ 500 $ 510 $ 320 $ 300 Accounts receivable 1,600 1,800 450 600 500 640 Inventory 1,350 1,300 500 900 320 490 Total current assets $3,700 $4,000 $1,450 $2,010 $1,140 $1,430 Plant assets (net) 3,500 3,400 2,550 2,402 740 810 Total assets $7,200 $7,400 $4,000 $4,412 $1,880 $2,240 Liabilities and equities Accounts payable $ 575 $ 620 $ 250 $ 315 $ 190 $ 380 Other current liabilities 680 720 454 450 560 709 Total current liabilities $1,255 $1,340 $ 704 $ 765 $ 750 $1,089 Long-term debt -0- -0- -0- -0- -0- -0- Total liabilities $1,255 $1,340 $ 704 $ 765 $ 750 $1,089 Common stock $ 745 $ 745 $ 496 $ 496 $ 450 $ 450 Retained earnings 5,200 5,315 2,800 3,151 680 701 Total shareholders' equity $5,945 $6,060 $3,296 $3,647 $1,130 $1,151 Total liabilities and equities $7,200 $7,400 $4,000 $4,412 $1,880 $2,240When I look at the nancial statements. I can see immediately that Ade [Darmadi. VPIndonesia] has outperformed Isadore [Real VPPhilippines]. But Indonesia is a much larger market than the Philippines. So I calculate R01 to try and adjust for size and now Isadore is outperforming Ade. When I mention this to Ade. she counters that although Indonesia is larger. it is also poorer and geographically dispersed. leading to higher distribution costs. The only thing I can say for sure is that Binh [Tran VPVietnam] has not developed much ofa market. I also wonder whether headquarters is looking at the right performance measure. I recently attended a seminar on new performance evaluation measures. and the seminar speaker spent quite a bit oftime on something called economic value added [EVA]. The wayI understand it. EVA adjusts prot and subtracts a capital charge from it. The capital charge is the cost of capital multiplied by the net assets [total assets less current liabilities) employed. I guess Iwould use the cost ofcapital of 20 percent after-tax that corporate policy requires I use for investment decisions. The problem I have is I am not sure how to adjust income. which is an accounting measure. into something more meaningful. We don't do any MD here. so the only item on the statements that was mentioned at the seminar is advertising. [.Votc: Advertising expenses for the previous three years are shown in Exhibit 14.18.] When I was working in the United States. I came across a study stating that advertising expenditures in our industry have an expected life of about three years. It'that's true. then clearly the way we account for advertising is wrong and I should adjust these results accordingly. Page 633 Exhibit 14.18 Historical Advertising Expenses. Southeast Asia Emerging Markets SectorBarrows Consumer Products Year Indonesia The Philippines Vietnam Total Year? $5.100 $2.502 $600 $8,202 Yea r 6 4,2 00 2 .400 549 1149 Year 5 4,500 2,?00 570 1WD There are other issues that I think are more ambiguous. For one thing. Binh developed a new approach for delivering products that cut distribution costs in Vietnam. At our annual retreat. he shared his ideas with Ade and Isadore about how they could adapt this to their markets. In addition. many customers want their stores in Vietnam and Indonesia to be entirely served from Indonesia. so Binh receives no credit for that business. Required a. What are some ofthe factors causing the problems in measuring performance in the Southeast Asia Sector? b. Rank the three countries using each ofthe following measures of performance: 1. Country prot. 2. Return on investment. 3. Economic value added (EVA). c'. Are there other performance measures you would suggest? How would you measure these? at. Write a onepage memo to Ms. Karlson explaining which country performed best. Be sure to explain your reasoning
Step by Step Solution
There are 3 Steps involved in it
1 Expert Approved Answer
Step: 1 Unlock
Question Has Been Solved by an Expert!
Get step-by-step solutions from verified subject matter experts
Step: 2 Unlock
Step: 3 Unlock
Students Have Also Explored These Related Accounting Questions!