

Question: Interpret the independent two sample test results Group Statistics Std. Error Group N Mean Std. Deviation Mean Score Controlled 21 2.7619 43644 09524 Experiment 19
Interpret the independent two sample test results
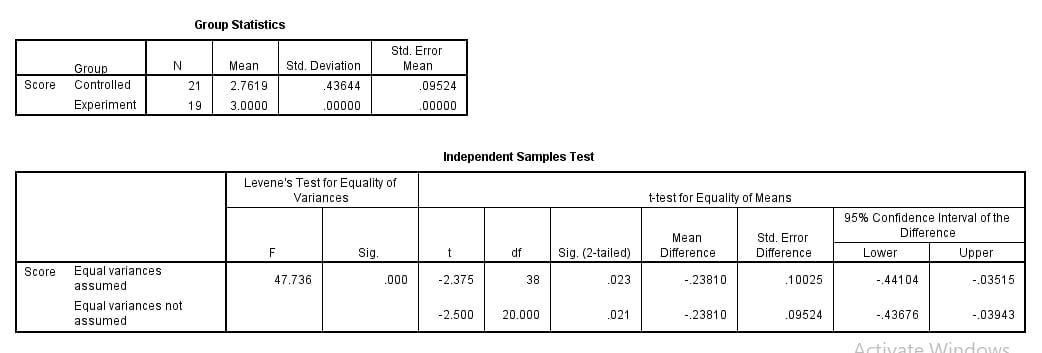
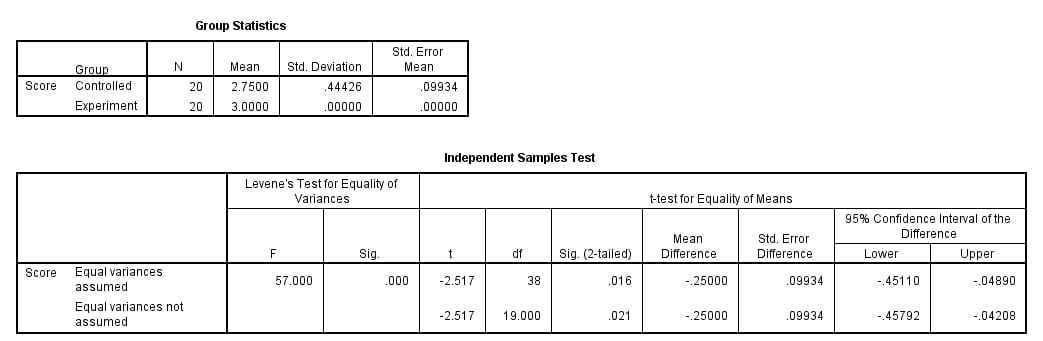
Group Statistics Std. Error Group N Mean Std. Deviation Mean Score Controlled 21 2.7619 43644 09524 Experiment 19 3.0000 00000 00000 Independent Samples Test Levene's Test for Equality of Variances t-test for Equality of Means 95% Confidence Interval of the Mean Std. Error Difference F Sig df Sig. (2-tailed) Difference Difference Lower Upper Score Equal variances assumed 47.736 000 -2.375 38 023 -.23810 10025 -.44104 -.03515 Equal variances not assumed -2.500 20.000 021 -.23810 09524 -.43676 .03943Group Statistics Std. Error Group N Mean Std. Deviation Mean Score Controlled 20 2.7500 44426 09934 Experiment 20 3.0000 00000 00000 Independent Samples Test Levene's Test for Equality of Variances t-test for Equality of Means 95% Confidence Interval of the Mean Std. Error Difference F Sig df Sig. (2-tailed) Difference Difference Lower Upper Score Equal variances assumed 57.000 000 -2.517 38 016 -.25000 09934 -.45110 .04890 Equal variances not assumed -2.517 19.000 021 -.25000 09934 -.45792 -.04208
Step by Step Solution
There are 3 Steps involved in it

Get step-by-step solutions from verified subject matter experts