

Question: Interpret this SPSS output Descriptive Statistics Dependent Variable: sales coupon level in store promotion Mean Std. Deviation N 9,20 837 N 7.6 1,140 3 5.40
Interpret this SPSS output

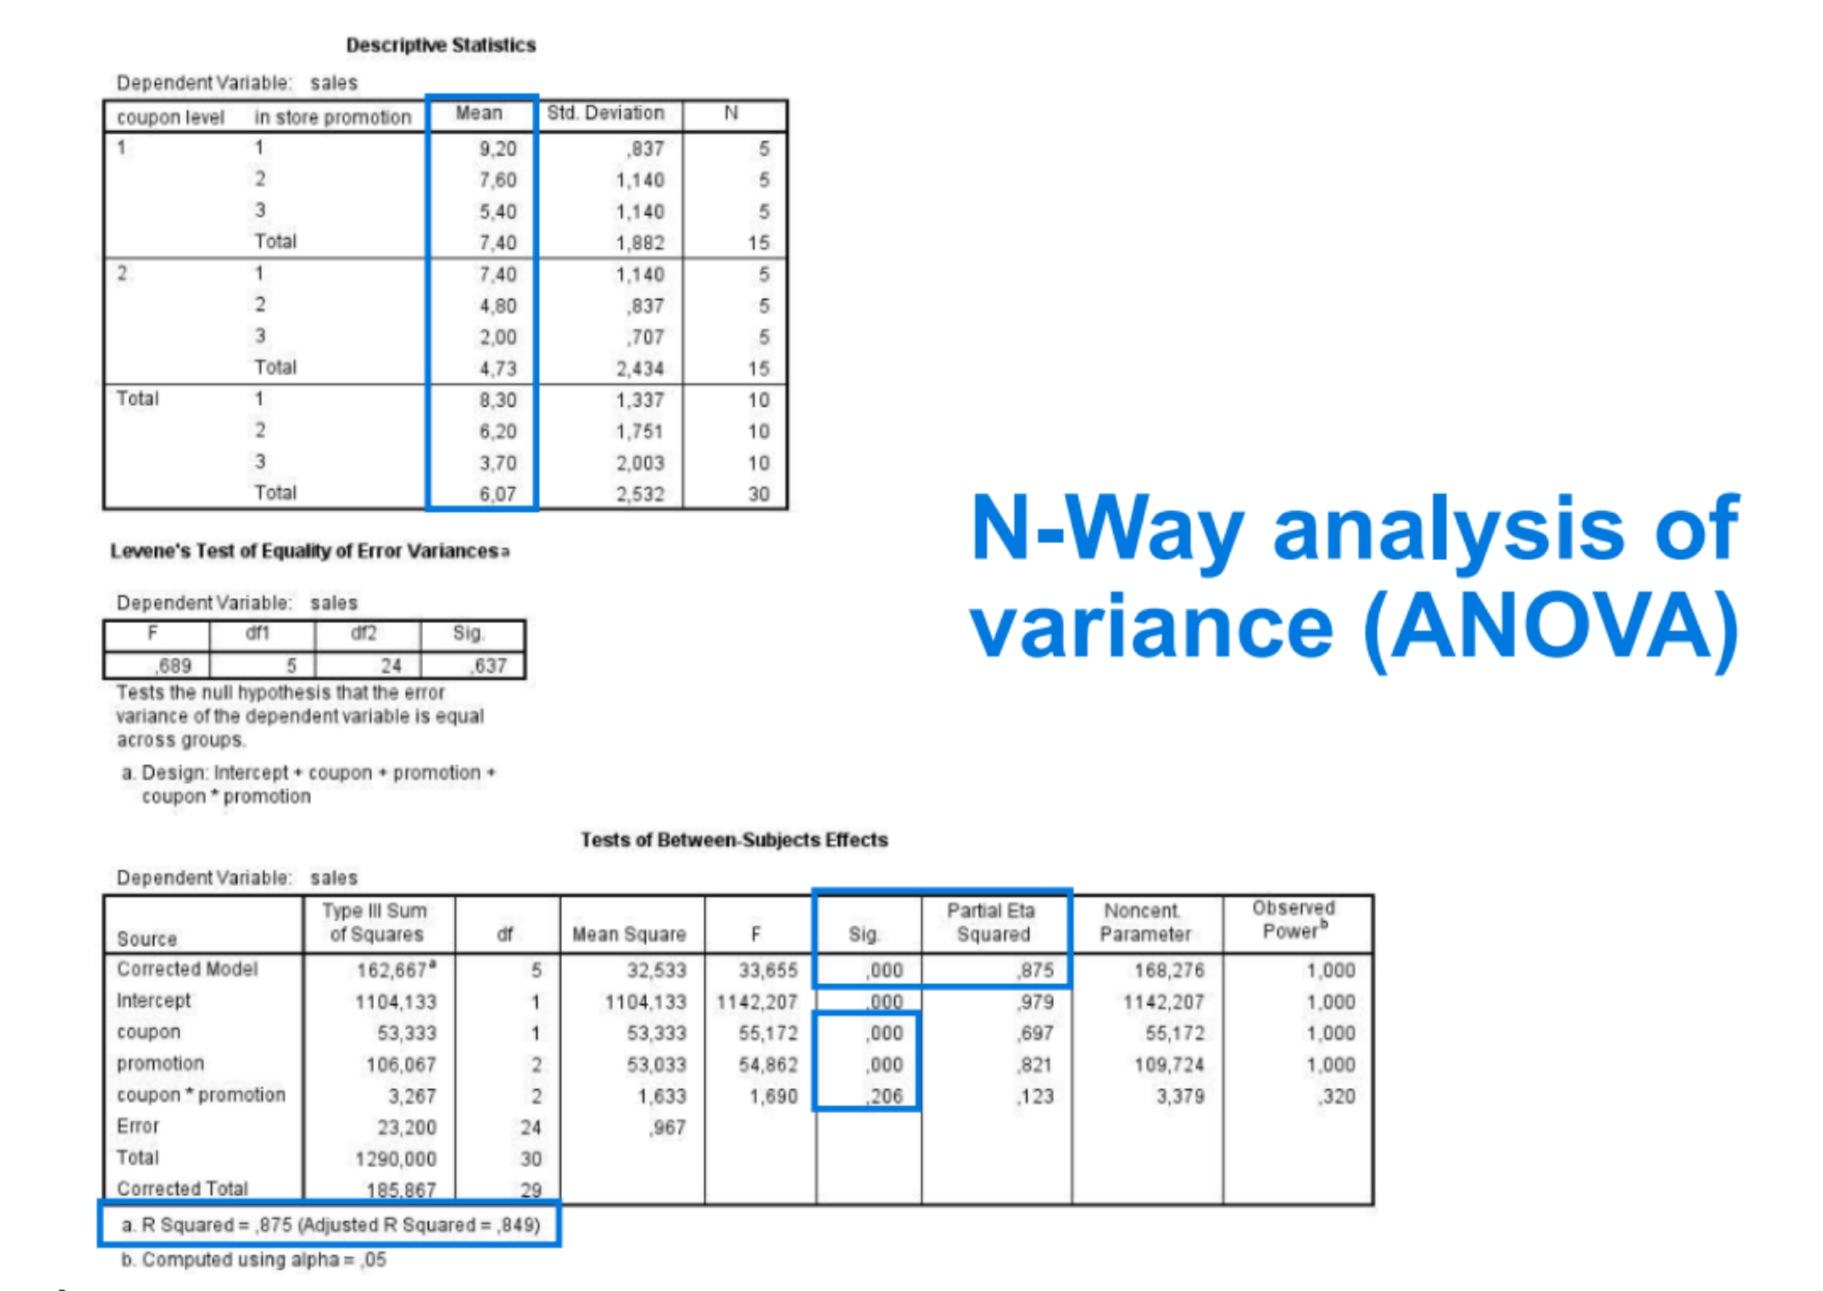
Descriptive Statistics Dependent Variable: sales coupon level in store promotion Mean Std. Deviation N 9,20 837 N 7.6 1,140 3 5.40 1,140 Total 7.40 1,882 15 2 7.4 1,140 5 N 4.80 .837 5 3 2.00 707 5 Total 4.73 2,434 15 Total 1 8,30 1,337 10 IN 6,20 1,751 10 3 3,7 2,003 10 Total 6.07 2,532 30 Levene's Test of Equality of Error Variancesa N-Way analysis of Dependent Variable: sales of1 df2 Sig. variance (ANOVA) 689 637 Tests the null hypothesis that the error variance of the dependent variable is equal across groups. a. Design: Intercept * coupon * promotion + coupon * promotion Tests of Between-Subjects Effects Dependent Variable: sales Type Ill Sum Partial Eta Noncent Observed Source of Squares Mean Square Sig Squared Parameter Power Corrected Model 162,667" 32,533 33,655 000 875 168,276 1,000 Intercept 1104,133 1104.133 1142,207 979 1142,207 1,000 coupon 53,333 53,333 55,172 ,000 697 55,172 1,000 promotion 106,067 53.033 54,862 .000 821 109,724 1.000 NN coupon * promotion 3,267 1.633 1,690 206 .123 3,379 .320 Error 23,200 24 967 Total 1290,000 30 Corrected Total 185.867 29 a. R Squared = ,875 (Adjusted R Squared = ,849) b. Computed using alpha = ,05
Step by Step Solution
There are 3 Steps involved in it

Get step-by-step solutions from verified subject matter experts