

Question: Interpret this SPSS output . EXAMPLE: The level of satisfaction with the SNS increases with the number of connections/friends Descriptive Statistics Mean Std. Deviation N

Interpret this SPSS output
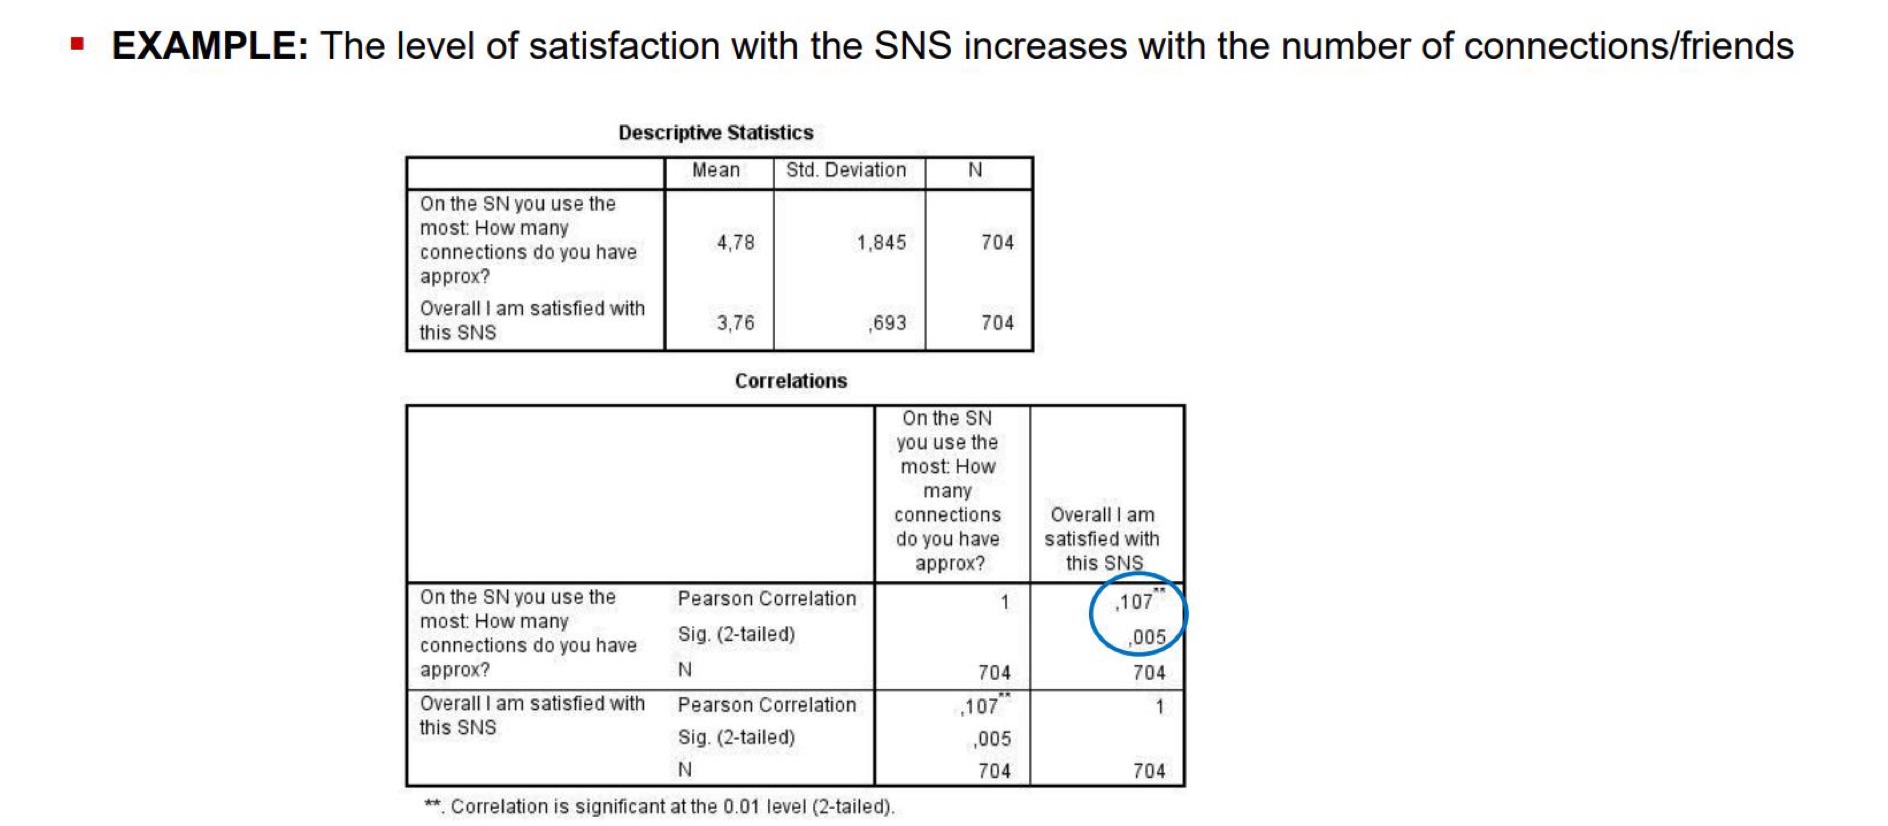
. EXAMPLE: The level of satisfaction with the SNS increases with the number of connections/friends Descriptive Statistics Mean Std. Deviation N On the SN you use the most: How many connections do you have 4,78 1,845 704 approx? Overall I am satisfied with this SNS 3,76 ,693 704 Correlations On the SN you use the most: How many connections Overall I am do you have satisfied with approx? this SNS On the SN you use the Pearson Correlation 107 most: How many connections do you have Sig. (2-tailed) 005 approx? N 704 704 Overall I am satisfied with Pearson Correlation ,107 this SNS Sig. (2-tailed) ,005 N 704 704 *Correlation is significant at the 0.01 level (2-tailed)
Step by Step Solution
There are 3 Steps involved in it

Get step-by-step solutions from verified subject matter experts