

Question: Intro Return statistics for AT&T, General motors, the S&P 500 and the risk-free asset, Treasury bills, are given below: A | D E 1 Year
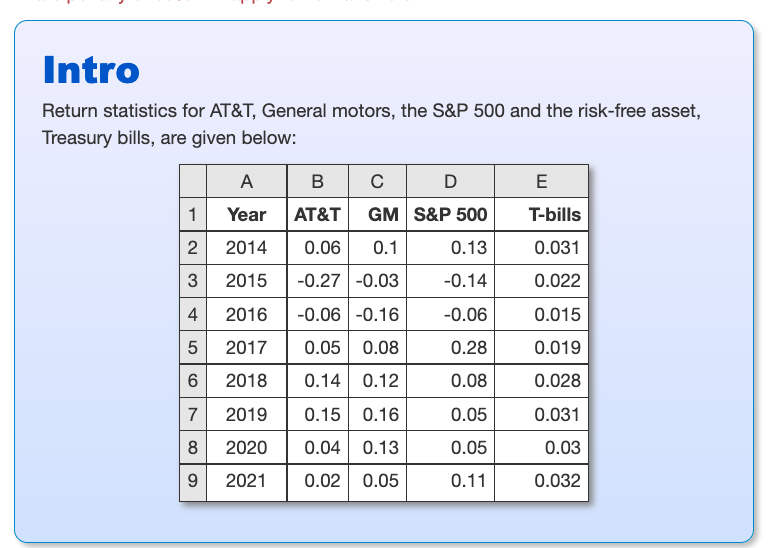
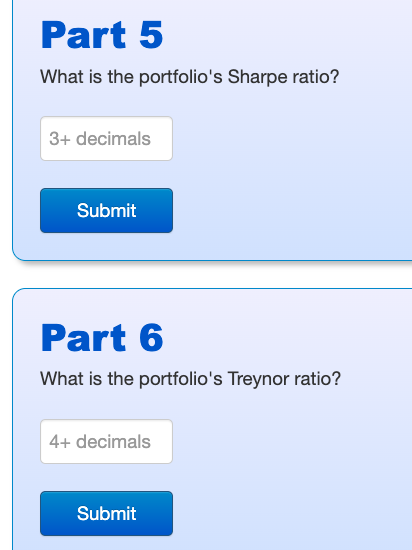
Intro Return statistics for AT&T, General motors, the S&P 500 and the risk-free asset, Treasury bills, are given below: A | D E 1 Year AT&T GM S&P 500 T-bills 2 2014 0.06 0.1 0.13 0.031 3 2015 -0.27 -0.03 -0.14 0.022 2016 -0.06 -0.16 -0.06 0.015 2017 0.05 0.08 0.28 0.019 2018 0.14 0.12 0.08 0.028 2019 0.15 0.16 0.05 0.031 2020 0.04 0.13 0.05 0.03 2021 0.02 0.05 0.11 0.032 st 4 LO 5 6 7 8 9 Part 5 What is the portfolio's Sharpe ratio? 3+ decimals Submit Part 6 What is the portfolio's Treynor ratio? 4+ decimals Submit Intro Return statistics for AT&T, General motors, the S&P 500 and the risk-free asset, Treasury bills, are given below: A | D E 1 Year AT&T GM S&P 500 T-bills 2 2014 0.06 0.1 0.13 0.031 3 2015 -0.27 -0.03 -0.14 0.022 2016 -0.06 -0.16 -0.06 0.015 2017 0.05 0.08 0.28 0.019 2018 0.14 0.12 0.08 0.028 2019 0.15 0.16 0.05 0.031 2020 0.04 0.13 0.05 0.03 2021 0.02 0.05 0.11 0.032 st 4 LO 5 6 7 8 9 Part 5 What is the portfolio's Sharpe ratio? 3+ decimals Submit Part 6 What is the portfolio's Treynor ratio? 4+ decimals Submit
Step by Step Solution
There are 3 Steps involved in it

Get step-by-step solutions from verified subject matter experts