

Question: Introduction Microsoft Excel Pivot Tables are a quick and effective way to obtain various summary measurements about a dataset. It is then possible to use
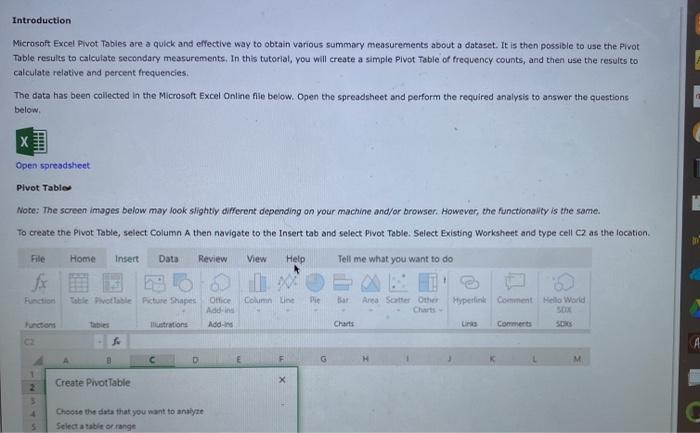
Introduction Microsoft Excel Pivot Tables are a quick and effective way to obtain various summary measurements about a dataset. It is then possible to use the Pivot Table results to calculate secondary measurements. In this tutorial, you will create a simple Pivot Table of frequency counts, and then use the results to calculate relative and percent frequencies. The data has been collected in the Microsoft Excel Online file below. Open the spreadsheet and perform the required analysis to answer the questions below Open spreadsheet Pivot Table Note: The screen images below may look slightly different depending on your machine and/or browser. However, the functionality is the same. To create the Pivot Table, select Column A then navigate to the Insert tab and select Pivot Table. Stiect existing Worksheet and type cell C2 as the location File Home Insert Data Review View Help Tell me what you want to do Function Table Pivottable Picture Shapes Column Ple Bar Ana Sarter Other Hyperlink Comment Hello World Office Addin Addins Charts La Comments Functions ca D M 1 2 Create Pivot Table Choose the data that you want to analyze Select atbit orange Introduction Microsoft Excel Pivot Tables are a quick and effective way to obtain various summary measurements about a dataset. It is then possible to use the Pivot Table results to calculate secondary measurements. In this tutorial, you will create a simple Pivot Table of frequency counts, and then use the results to calculate relative and percent frequencies. The data has been collected in the Microsoft Excel Online file below. Open the spreadsheet and perform the required analysis to answer the questions below Open spreadsheet Pivot Table Note: The screen images below may look slightly different depending on your machine and/or browser. However, the functionality is the same. To create the Pivot Table, select Column A then navigate to the Insert tab and select Pivot Table. Stiect existing Worksheet and type cell C2 as the location File Home Insert Data Review View Help Tell me what you want to do Function Table Pivottable Picture Shapes Column Ple Bar Ana Sarter Other Hyperlink Comment Hello World Office Addin Addins Charts La Comments Functions ca D M 1 2 Create Pivot Table Choose the data that you want to analyze Select atbit orange
Step by Step Solution
There are 3 Steps involved in it

Get step-by-step solutions from verified subject matter experts