

Question: Inventory Errors : Fill in the following chart [9 Marks] Income Statement With Correct Ending Inventory Year 1 Year 2 Sales $240,000 $265,000 Cost of
![Inventory Errors : Fill in the following chart [9 Marks] Income](https://dsd5zvtm8ll6.cloudfront.net/si.experts.images/questions/2024/10/66fbaceae49fd_83466fbacea736c0.jpg)
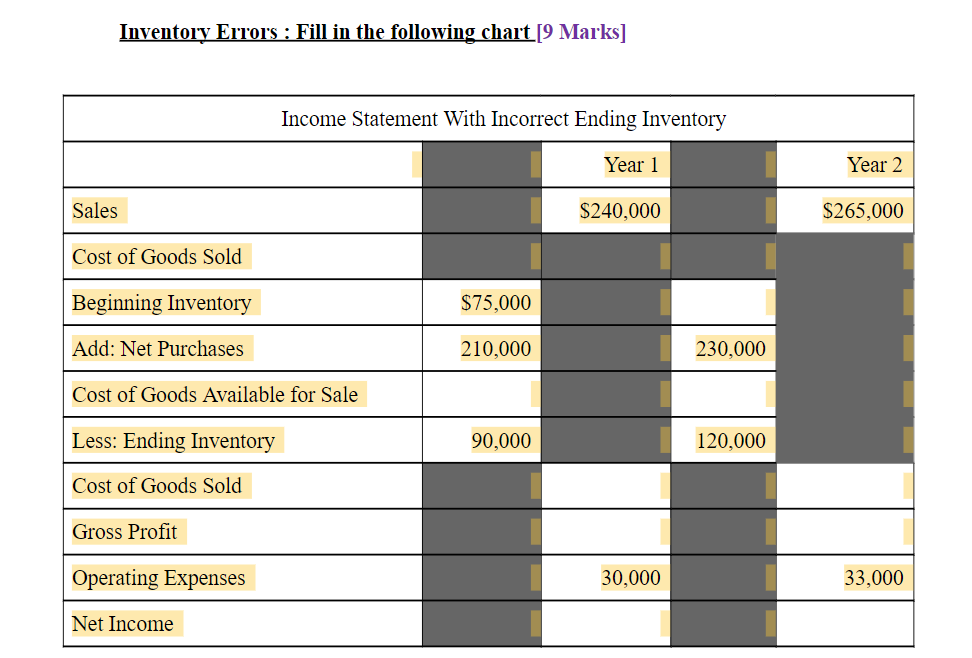
Inventory Errors : Fill in the following chart [9 Marks] Income Statement With Correct Ending Inventory Year 1 Year 2 Sales $240,000 $265,000 Cost of Goods Sold Beginning Inventory $75,000 Add: Net Purchases 210,000 230.000 Cost of Goods Available for Sale Less: Ending Inventory 100,000 120,000 Cost of Goods Sold Gross Profit Operating Expenses 30,000 33,000 Net Income Inventory Errors : Fill in the following chart [9 Marks] Income Statement With Incorrect Ending Inventory Year 1 Year 2 Sales $240,000 $265,000 Cost of Goods Sold Beginning Inventory $75,000 Add: Net Purchases 210,000 230,000 Cost of Goods Available for Sale Less: Ending Inventory 90,000 120,000 Cost of Goods Sold Gross Profit Operating Expenses 30,000 33,000 Net Income
Step by Step Solution
There are 3 Steps involved in it

Get step-by-step solutions from verified subject matter experts