

Question: Is the process in control? b) What are the control limits for the range chart? UCLR = 0.78 ounces (round your response to two decimal
Is the process in control?
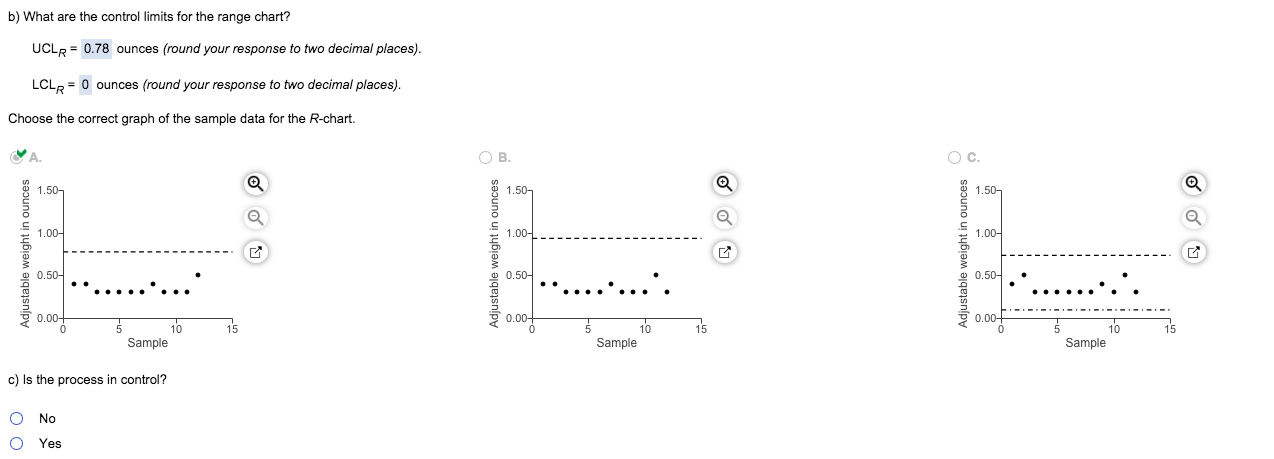
b) What are the control limits for the range chart? UCLR = 0.78 ounces (round your response to two decimal places). LCLR = 0 ounces (round your response to two decimal places). Choose the correct graph of the sample data for the R-chart. MA OB OC. 1.50 1.50 1.50 1.00 1.00- 1.00 Adjustable weight in ounces Adjustable weight in ounces 0.50- 0.50 0.50- Adjustable 0.00 0.00- 0.00 75 15 5 16 Sample 10 Sample 10 Sample c) Is the process in control? No YesStep by Step Solution
There are 3 Steps involved in it
1 Expert Approved Answer
Step: 1 Unlock

Question Has Been Solved by an Expert!
Get step-by-step solutions from verified subject matter experts
Step: 2 Unlock
Step: 3 Unlock