

Question: Ise graphical sensitivity analysis to determine a decision rule over which each of the decision alternatives has its largest expected value. The values given represent
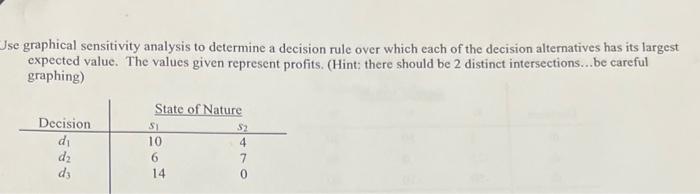
Ise graphical sensitivity analysis to determine a decision rule over which each of the decision alternatives has its largest expected value. The values given represent profits. (Hint: there should be 2 distinct intersections...be careful graphing)
Step by Step Solution
There are 3 Steps involved in it
1 Expert Approved Answer
Step: 1 Unlock

Question Has Been Solved by an Expert!
Get step-by-step solutions from verified subject matter experts
Step: 2 Unlock
Step: 3 Unlock