

Question: Itos Dilemma Case: Using the Black-Scholes pricing function in Excel, compute an option value for each strike price and maturity date in case Exhibit 2.
Itos Dilemma Case:
-
Using the Black-Scholes pricing function in Excel, compute an option value for each strike price and maturity date in case Exhibit 2. For simplicity, assume zero dividend yield. Also, use Louise Itos volatility estimates, provided in case Exhibit 1.
-
Does the model yield logical estimates with respect to intrinsic value and time-to- maturity? What happens to the option premiums as you change the volatility? Can you explain why volatility affects prices in such a manner?
-
How do your estimates compare with the actual quoted prices? Can you explain the differences? Assuming your prices are correct, which options would you buy or sell?
-
Are there any problems with the way Ito estimated the volatility numbers? Can you think of another way to estimate volatility that might yield estimates closer to the actual quotes?
-
Using the Black-Scholes pricing function in Excel, calculate how sensitive IBMs March 110 call price is to changes in stock price. How much does the call price vary for $0.50 changes in IBM share price when the option is at the money (assume stock price=$110), in the money (assume stock price=$115), and out of the money (assume stock price=$105)? What does this sensitivity analysis tell you?
Please include excel sheet for reference.
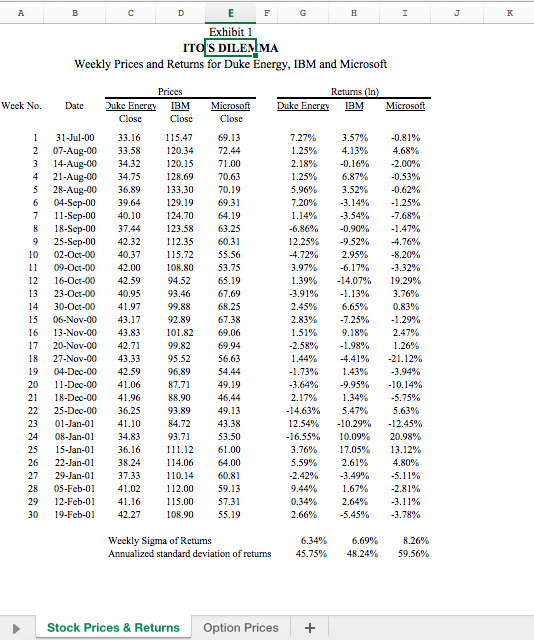
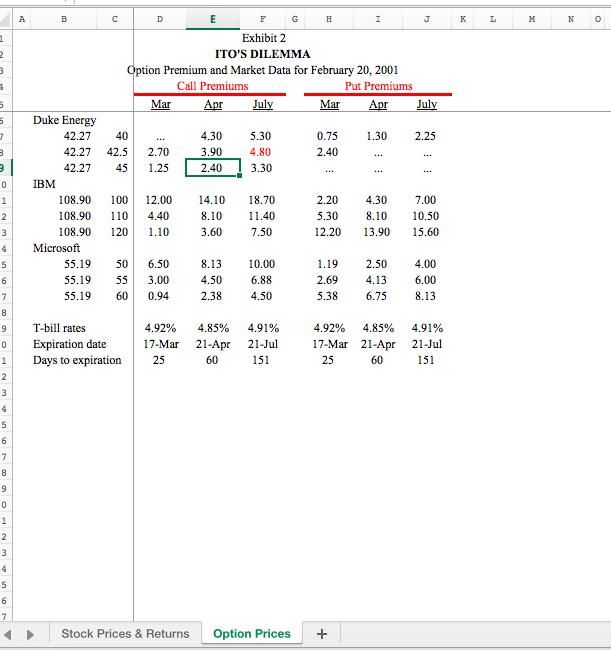
Exhibit 1 ITOS DILEMA Weekly Prices and Returns for Duke Energy, IBM and Microsoft Returns (In) Duke Energy IBM Microsoft Prices Week No. Date Duke Energy IBM Close Close 1 31-Jul-00 33.16 115.47 07-Aug-00 33.58 120.34 14-Aug-0034.32 120.15 4 21-Aug-00 34.75 128.69 5 28-Aug-00 36.89 133.30 6 04-Sep-00 39.64 129.19 7 11-Sep-00 40.10 124.70 8 18-Sep-00 37.44 123.58 9 25-Sep-00 42.32 112.35 10 02-Oct-00 40.37 115.72 11 09-Oct-00 42.00 108.80 12 16-Oct-00 42.59 94.52 13 23-Oct-00 40.95 93.46 14 30-Oct-00 41.97 99.88 15 06-Nov-00 43.17 92.89 16 13-Nov-00 43.83 101.82 17 20-Nov-00 42.71 99.82 18 27-Nov-00 43.33 95.52 1904-Dec-00 42.59 96.89 2011-Dec-00 41.06 87.71 21 18-Dec-00 41.96 88.90 22 25-Dec-0036.2593.89 23 01-Jan-01 41.10 84.72 08-Jan-01 3 4.83 93.71 25 15-Jan-01 36.16 111.12 26 22-Jan-01 3 8.24 114.06 27 29-Jan-01 37.33 110.14 28 05-Feb-01 41.02 112.00 29 12-Feb-01 41.16 115.00 30 19-Feb-01 42.27 108.90 Microsoft Close 69.13 72.44 71.00 70.63 70.19 69.31 64.19 63.25 60.31 55.56 53.75 65.19 67.69 68.25 67.38 69.06 69.94 56.63 54.44 49.19 46.44 49.13 43.38 53.50 61.00 64.00 60.81 59.13 57.31 55.19 7.27% 1.25% 2.18% 1.25% 5.96% 7.20% 1.14% -6.86% 12.25% -4.72% 3.97% 1.39% -3.91% 2.45% 2.83% 1.51% -2.58% 1.44% -1.73% -3.64% 2.17 -14.63% 12.54% -16.55% 3.76% 5.59% -2.42% 3.57% 4.13% -0.16% 6.87% 3.52% -3.14% -3.54% -0.90% -9.52% 2.95% -6.17% -14.07% -1.13% 6,65% -7.25% 9.18% -1.98% -4.41% 1.43% -9.95% 1.34% 5.47% - 10.29% 10.09% 17.05% 2.61% -3.49% 1.67% 2.64% -5.45% -0.81% 4.68% -2.00% -0.53% -0.6296 -1.25% -7.68% -1.47% -4.76% -8.20% -3.32% 19.29% 3.76% 0.83% -1.29% 2.47% 1.26% -21.129 -3.94% -10.14% -5.75% 5.63% -12.45% 20.98% 13.12% 4.80% -5.11% -2.81% -3.11% -3.78% 0.34% 2.66% Weekly Sigma of Returns Annualized standard deviation of returns 6.34% 45.75% 6.69% 48.24% 8.26% 59.56% Stock Prices & Returns Option Prices + dn m inun mm Exhibit 2 ITO'S DILEMMA Option Premium and Market Data for February 20, 2001 Call Premiums Put Premiums Mar Apr July Mar Apr July Duke Energy 42.27 40 ... .. 4.30 5.30 0.75 1.30 2.25 42.27 42.5 2.70 3.90 4.80 2.40 42.27 45 1.25 2.40 3.30 IBM 108.90 100 12.00 14.10 18.70 2.20 4.30 7.00 108.90 110 4.40 8.10 11.40 5.30 8.10 10.50 108.90 120 1.10 3.60 7.50 12.20 13.90 15.60 Microsoft 55.19 50 8.13 10.00 1.19 2.50 4.00 55.1955 3.00 4.50 6.88 2.69 4.136 .00 55.1960 0.94 2.38 4.50 5.38 6.75 8.13 4 Nm 0 0 0 T-bill rates Expiration date Days to expiration 4.92% 17-Mar 25 4.85% 21-Apr 60 4.91% 21-Jul 151 4.92% 4.85% 17-Mar 21-Apr 25 60 4.91% 21-Jul 151 Stock Prices & Returns Option Prices + Exhibit 1 ITOS DILEMA Weekly Prices and Returns for Duke Energy, IBM and Microsoft Returns (In) Duke Energy IBM Microsoft Prices Week No. Date Duke Energy IBM Close Close 1 31-Jul-00 33.16 115.47 07-Aug-00 33.58 120.34 14-Aug-0034.32 120.15 4 21-Aug-00 34.75 128.69 5 28-Aug-00 36.89 133.30 6 04-Sep-00 39.64 129.19 7 11-Sep-00 40.10 124.70 8 18-Sep-00 37.44 123.58 9 25-Sep-00 42.32 112.35 10 02-Oct-00 40.37 115.72 11 09-Oct-00 42.00 108.80 12 16-Oct-00 42.59 94.52 13 23-Oct-00 40.95 93.46 14 30-Oct-00 41.97 99.88 15 06-Nov-00 43.17 92.89 16 13-Nov-00 43.83 101.82 17 20-Nov-00 42.71 99.82 18 27-Nov-00 43.33 95.52 1904-Dec-00 42.59 96.89 2011-Dec-00 41.06 87.71 21 18-Dec-00 41.96 88.90 22 25-Dec-0036.2593.89 23 01-Jan-01 41.10 84.72 08-Jan-01 3 4.83 93.71 25 15-Jan-01 36.16 111.12 26 22-Jan-01 3 8.24 114.06 27 29-Jan-01 37.33 110.14 28 05-Feb-01 41.02 112.00 29 12-Feb-01 41.16 115.00 30 19-Feb-01 42.27 108.90 Microsoft Close 69.13 72.44 71.00 70.63 70.19 69.31 64.19 63.25 60.31 55.56 53.75 65.19 67.69 68.25 67.38 69.06 69.94 56.63 54.44 49.19 46.44 49.13 43.38 53.50 61.00 64.00 60.81 59.13 57.31 55.19 7.27% 1.25% 2.18% 1.25% 5.96% 7.20% 1.14% -6.86% 12.25% -4.72% 3.97% 1.39% -3.91% 2.45% 2.83% 1.51% -2.58% 1.44% -1.73% -3.64% 2.17 -14.63% 12.54% -16.55% 3.76% 5.59% -2.42% 3.57% 4.13% -0.16% 6.87% 3.52% -3.14% -3.54% -0.90% -9.52% 2.95% -6.17% -14.07% -1.13% 6,65% -7.25% 9.18% -1.98% -4.41% 1.43% -9.95% 1.34% 5.47% - 10.29% 10.09% 17.05% 2.61% -3.49% 1.67% 2.64% -5.45% -0.81% 4.68% -2.00% -0.53% -0.6296 -1.25% -7.68% -1.47% -4.76% -8.20% -3.32% 19.29% 3.76% 0.83% -1.29% 2.47% 1.26% -21.129 -3.94% -10.14% -5.75% 5.63% -12.45% 20.98% 13.12% 4.80% -5.11% -2.81% -3.11% -3.78% 0.34% 2.66% Weekly Sigma of Returns Annualized standard deviation of returns 6.34% 45.75% 6.69% 48.24% 8.26% 59.56% Stock Prices & Returns Option Prices + dn m inun mm Exhibit 2 ITO'S DILEMMA Option Premium and Market Data for February 20, 2001 Call Premiums Put Premiums Mar Apr July Mar Apr July Duke Energy 42.27 40 ... .. 4.30 5.30 0.75 1.30 2.25 42.27 42.5 2.70 3.90 4.80 2.40 42.27 45 1.25 2.40 3.30 IBM 108.90 100 12.00 14.10 18.70 2.20 4.30 7.00 108.90 110 4.40 8.10 11.40 5.30 8.10 10.50 108.90 120 1.10 3.60 7.50 12.20 13.90 15.60 Microsoft 55.19 50 8.13 10.00 1.19 2.50 4.00 55.1955 3.00 4.50 6.88 2.69 4.136 .00 55.1960 0.94 2.38 4.50 5.38 6.75 8.13 4 Nm 0 0 0 T-bill rates Expiration date Days to expiration 4.92% 17-Mar 25 4.85% 21-Apr 60 4.91% 21-Jul 151 4.92% 4.85% 17-Mar 21-Apr 25 60 4.91% 21-Jul 151 Stock Prices & Returns Option Prices +
Step by Step Solution
There are 3 Steps involved in it

Get step-by-step solutions from verified subject matter experts