

Question: Using the Black-Scholes pricing function in Excel, compute an option value for each strike price and maturity date in case Exhibit 2. For simplicity, assume
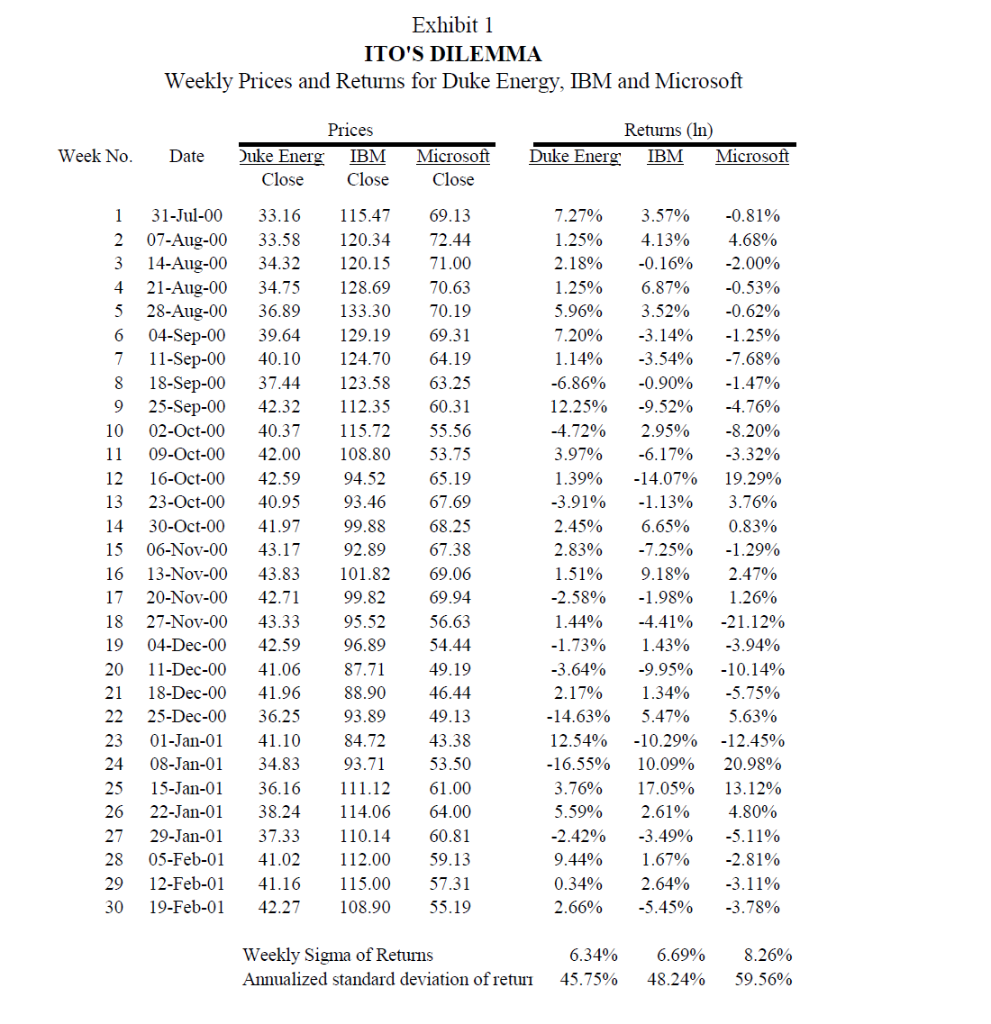
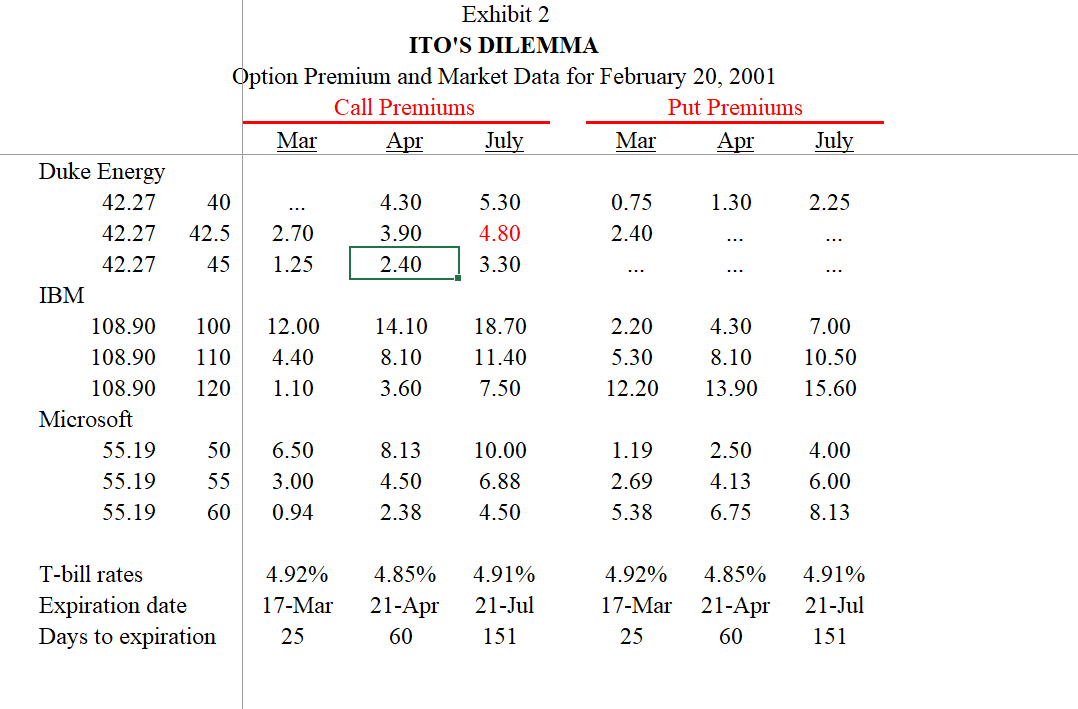
Using the Black-Scholes pricing function in Excel, compute an option value for each strike price and maturity date in case Exhibit 2. For simplicity, assume zero dividend yield. Also, use Louise Itos volatility estimates, provided in case Exhibit 1.
Exhibit 1 ITO'S DILEMMA Weekly Prices and Returns for Duke Energy, IBM and Microsoft Returns (In Duke Energ IBM Microsoft Week No. Prices Duke Energ IBM Close Close Date Microsoft Close 1 2 3 4 5 6 7 8 9 31-Jul-00 07-Aug-00 14-Aug-00 21-Aug-00 28-Aug-00 04-Sep-00 11-Sep-00 18-Sep-00 25-Sep-00 02-Oct-00 09-Oct-00 16-Oct-00 23-Oct-00 30-Oct-00 06-Nov-00 13-Nov-00 20-Nov-00 27-Nov-00 04-Dec-00 11-Dec-00 18-Dec-00 25-Dec-00 01-Jan-01 08-Jan-01 15-Jan-01 22-Jan-01 29-Jan-01 05-Feb-01 12-Feb-01 19-Feb-01 33.16 33.58 34.32 34.75 36.89 39.64 40.10 37.44 42.32 40.37 42.00 42.59 40.95 41.97 43.17 43.83 42.71 43.33 42.59 10 11 12 13 14 15 16 17 18 19 20 21 22 23 24 25 26 27 28 29 30 115.47 120.34 120.15 128.69 133.30 129.19 124.70 123.58 112.35 115.72 108.80 94.52 93.46 99.88 92.89 101.82 99.82 95.52 96.89 87.71 88.90 93.89 84.72 93.71 111.12 114.06 110.14 112.00 115.00 108.90 69.13 72.44 71.00 70.63 70.19 69.31 64.19 63.25 60.31 55.56 53.75 65.19 67.69 68.25 67.38 69.06 69.94 56.63 54.44 49.19 46.44 49.13 43.38 53.50 61.00 64.00 60.81 59.13 57.31 55.19 7.27% 1.25% 2.18% 1.25% 5.96% 7.20% 1.14% -6.86% 12.25% -4.72% 3.97% 1.39% -3.91% 2.45% 2.83% 1.51% -2.58% 1.44% -1.73% -3.64% 2.17% -14.63% 12.54% -16.55% 3.76% 5.59% -2.42% 9.44% 0.34% 2.66% 3.57% 4.13% -0.16% 6.87% 3.52% -3.14% -3.54% -0.90% -9.52% 2.95% -6.17% -14.07% -1.13% 6.65% -7.25% 9.18% -1.98% -4.41% 1.43% -9.95% 1.34% 5.47% -10.29% 10.09% 17.05% 2.61% -3.49% 1.67% 2.64% -5.45% -0.81% 4.68% -2.00% -0.53% -0.62% -1.25% -7.68% -1.47% -4.76% -8.20% -3.32% 19.29% 3.76% 0.83% -1.29% 2.47% 1.26% -21.12% -3.94% -10.14% -5.75% 5.63% -12.45% 20.98% 13.12% 4.80% -5.11% -2.81% -3.11% -3.78% 41.06 41.96 36.25 41.10 34.83 36.16 38.24 37.33 41.02 41.16 42.27 Weekly Sigma of Returns Annualized standard deviation of returi 6.34% 45.75% 6.69% 48.24% 8.26% 59.56% Exhibit 2 ITO'S DILEMMA Option Premium and Market Data for February 20, 2001 Call Premiums Put Premiums Mar Apr July Mar Apr July 1.30 2.25 40 42.5 45 4.30 3.90 2.40 2.70 1.25 5.30 4.80 3.30 0.75 2.40 Duke Energy 42.27 42.27 42.27 IBM 108.90 108.90 108.90 Microsoft 55.19 55.19 55.19 100 110 12.00 4.40 1.10 14.10 8.10 3.60 18.70 11.40 7.50 2.20 5.30 12.20 4.30 8.10 7.00 10.50 15.60 120 13.90 50 55 6.50 3.00 0.94 8.13 4.50 2.38 10.00 6.88 4.50 1.19 2.69 5.38 2.50 4.13 6.75 4.00 6.00 8.13 60 T-bill rates Expiration date Days to expiration 4.92% 17-Mar 25 4.85% 21-Apr 60 4.91% 21-Jul 151 4.92% 17-Mar 25 4.85% 21-Apr 60 4.91% 21-Jul 151 Exhibit 1 ITO'S DILEMMA Weekly Prices and Returns for Duke Energy, IBM and Microsoft Returns (In Duke Energ IBM Microsoft Week No. Prices Duke Energ IBM Close Close Date Microsoft Close 1 2 3 4 5 6 7 8 9 31-Jul-00 07-Aug-00 14-Aug-00 21-Aug-00 28-Aug-00 04-Sep-00 11-Sep-00 18-Sep-00 25-Sep-00 02-Oct-00 09-Oct-00 16-Oct-00 23-Oct-00 30-Oct-00 06-Nov-00 13-Nov-00 20-Nov-00 27-Nov-00 04-Dec-00 11-Dec-00 18-Dec-00 25-Dec-00 01-Jan-01 08-Jan-01 15-Jan-01 22-Jan-01 29-Jan-01 05-Feb-01 12-Feb-01 19-Feb-01 33.16 33.58 34.32 34.75 36.89 39.64 40.10 37.44 42.32 40.37 42.00 42.59 40.95 41.97 43.17 43.83 42.71 43.33 42.59 10 11 12 13 14 15 16 17 18 19 20 21 22 23 24 25 26 27 28 29 30 115.47 120.34 120.15 128.69 133.30 129.19 124.70 123.58 112.35 115.72 108.80 94.52 93.46 99.88 92.89 101.82 99.82 95.52 96.89 87.71 88.90 93.89 84.72 93.71 111.12 114.06 110.14 112.00 115.00 108.90 69.13 72.44 71.00 70.63 70.19 69.31 64.19 63.25 60.31 55.56 53.75 65.19 67.69 68.25 67.38 69.06 69.94 56.63 54.44 49.19 46.44 49.13 43.38 53.50 61.00 64.00 60.81 59.13 57.31 55.19 7.27% 1.25% 2.18% 1.25% 5.96% 7.20% 1.14% -6.86% 12.25% -4.72% 3.97% 1.39% -3.91% 2.45% 2.83% 1.51% -2.58% 1.44% -1.73% -3.64% 2.17% -14.63% 12.54% -16.55% 3.76% 5.59% -2.42% 9.44% 0.34% 2.66% 3.57% 4.13% -0.16% 6.87% 3.52% -3.14% -3.54% -0.90% -9.52% 2.95% -6.17% -14.07% -1.13% 6.65% -7.25% 9.18% -1.98% -4.41% 1.43% -9.95% 1.34% 5.47% -10.29% 10.09% 17.05% 2.61% -3.49% 1.67% 2.64% -5.45% -0.81% 4.68% -2.00% -0.53% -0.62% -1.25% -7.68% -1.47% -4.76% -8.20% -3.32% 19.29% 3.76% 0.83% -1.29% 2.47% 1.26% -21.12% -3.94% -10.14% -5.75% 5.63% -12.45% 20.98% 13.12% 4.80% -5.11% -2.81% -3.11% -3.78% 41.06 41.96 36.25 41.10 34.83 36.16 38.24 37.33 41.02 41.16 42.27 Weekly Sigma of Returns Annualized standard deviation of returi 6.34% 45.75% 6.69% 48.24% 8.26% 59.56% Exhibit 2 ITO'S DILEMMA Option Premium and Market Data for February 20, 2001 Call Premiums Put Premiums Mar Apr July Mar Apr July 1.30 2.25 40 42.5 45 4.30 3.90 2.40 2.70 1.25 5.30 4.80 3.30 0.75 2.40 Duke Energy 42.27 42.27 42.27 IBM 108.90 108.90 108.90 Microsoft 55.19 55.19 55.19 100 110 12.00 4.40 1.10 14.10 8.10 3.60 18.70 11.40 7.50 2.20 5.30 12.20 4.30 8.10 7.00 10.50 15.60 120 13.90 50 55 6.50 3.00 0.94 8.13 4.50 2.38 10.00 6.88 4.50 1.19 2.69 5.38 2.50 4.13 6.75 4.00 6.00 8.13 60 T-bill rates Expiration date Days to expiration 4.92% 17-Mar 25 4.85% 21-Apr 60 4.91% 21-Jul 151 4.92% 17-Mar 25 4.85% 21-Apr 60 4.91% 21-Jul 151
Step by Step Solution
There are 3 Steps involved in it

Get step-by-step solutions from verified subject matter experts