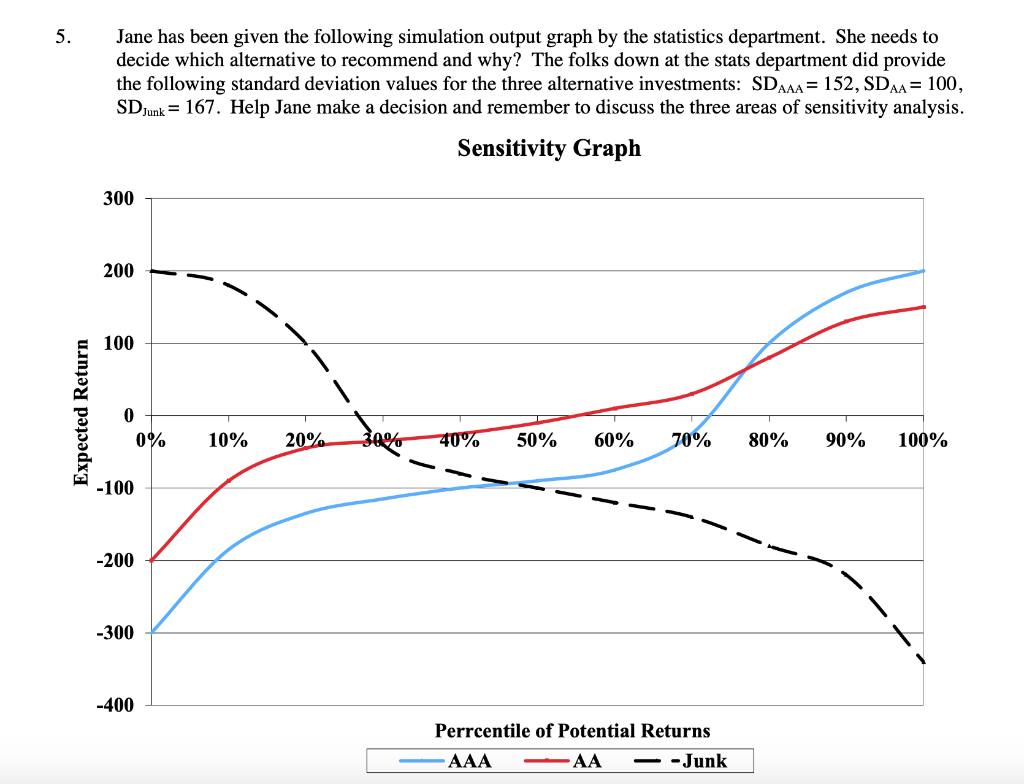
Question: Jane has been given the following simulation output graph by the statistics department. She needs to decide which alternative to recommend and why? The folks

Jane has been given the following simulation

Jane has been given the following simulation output graph by the statistics department. She needs to decide which alternative to recommend and why? The folks down at the stats department did provide the following standard deviation values for the three alternative investments: SDAAA = 152, SDAA = 100, SDJunk = 167. Help Jane make a decision and remember to discuss the three areas of sensitivity analysis. Sensitivity Graph Expected Return 0% 10% 20% 30% 40% 50% 60% 70% 80% 90% 100% -200 -300 -400 Perrcentile of Potential Returns AAA AA - - Junk Jane has been given the following simulation output graph by the statistics department. She needs to decide which alternative to recommend and why? The folks down at the stats department did provide the following standard deviation values for the three alternative investments: SDAAA = 152, SDAA = 100, SDJunk = 167. Help Jane make a decision and remember to discuss the three areas of sensitivity analysis. Sensitivity Graph Expected Return 0% 10% 20% 30% 40% 50% 60% 70% 80% 90% 100% -200 -300 -400 Perrcentile of Potential Returns AAA AA - - Junk

Step by Step Solution

There are 3 Steps involved in it

1 Expert Approved Answer
Step: 1 Unlock blur-text-image
Question Has Been Solved by an Expert!

Get step-by-step solutions from verified subject matter experts

Step: 2 Unlock
Step: 3 Unlock

Students Have Also Explored These Related General Management Questions!