

Question: Jupyter DATA 3 5 5 0 _ Homework _ 1 _ U Last Checkpoint: Last Tuesday at 1 1 : 2 8 AM ( autosaved
Jupyter DATA HomeworkU Last Checkpoint: Last Tuesday at : AM autosaved
Logout
Trusted
Python ipykernel
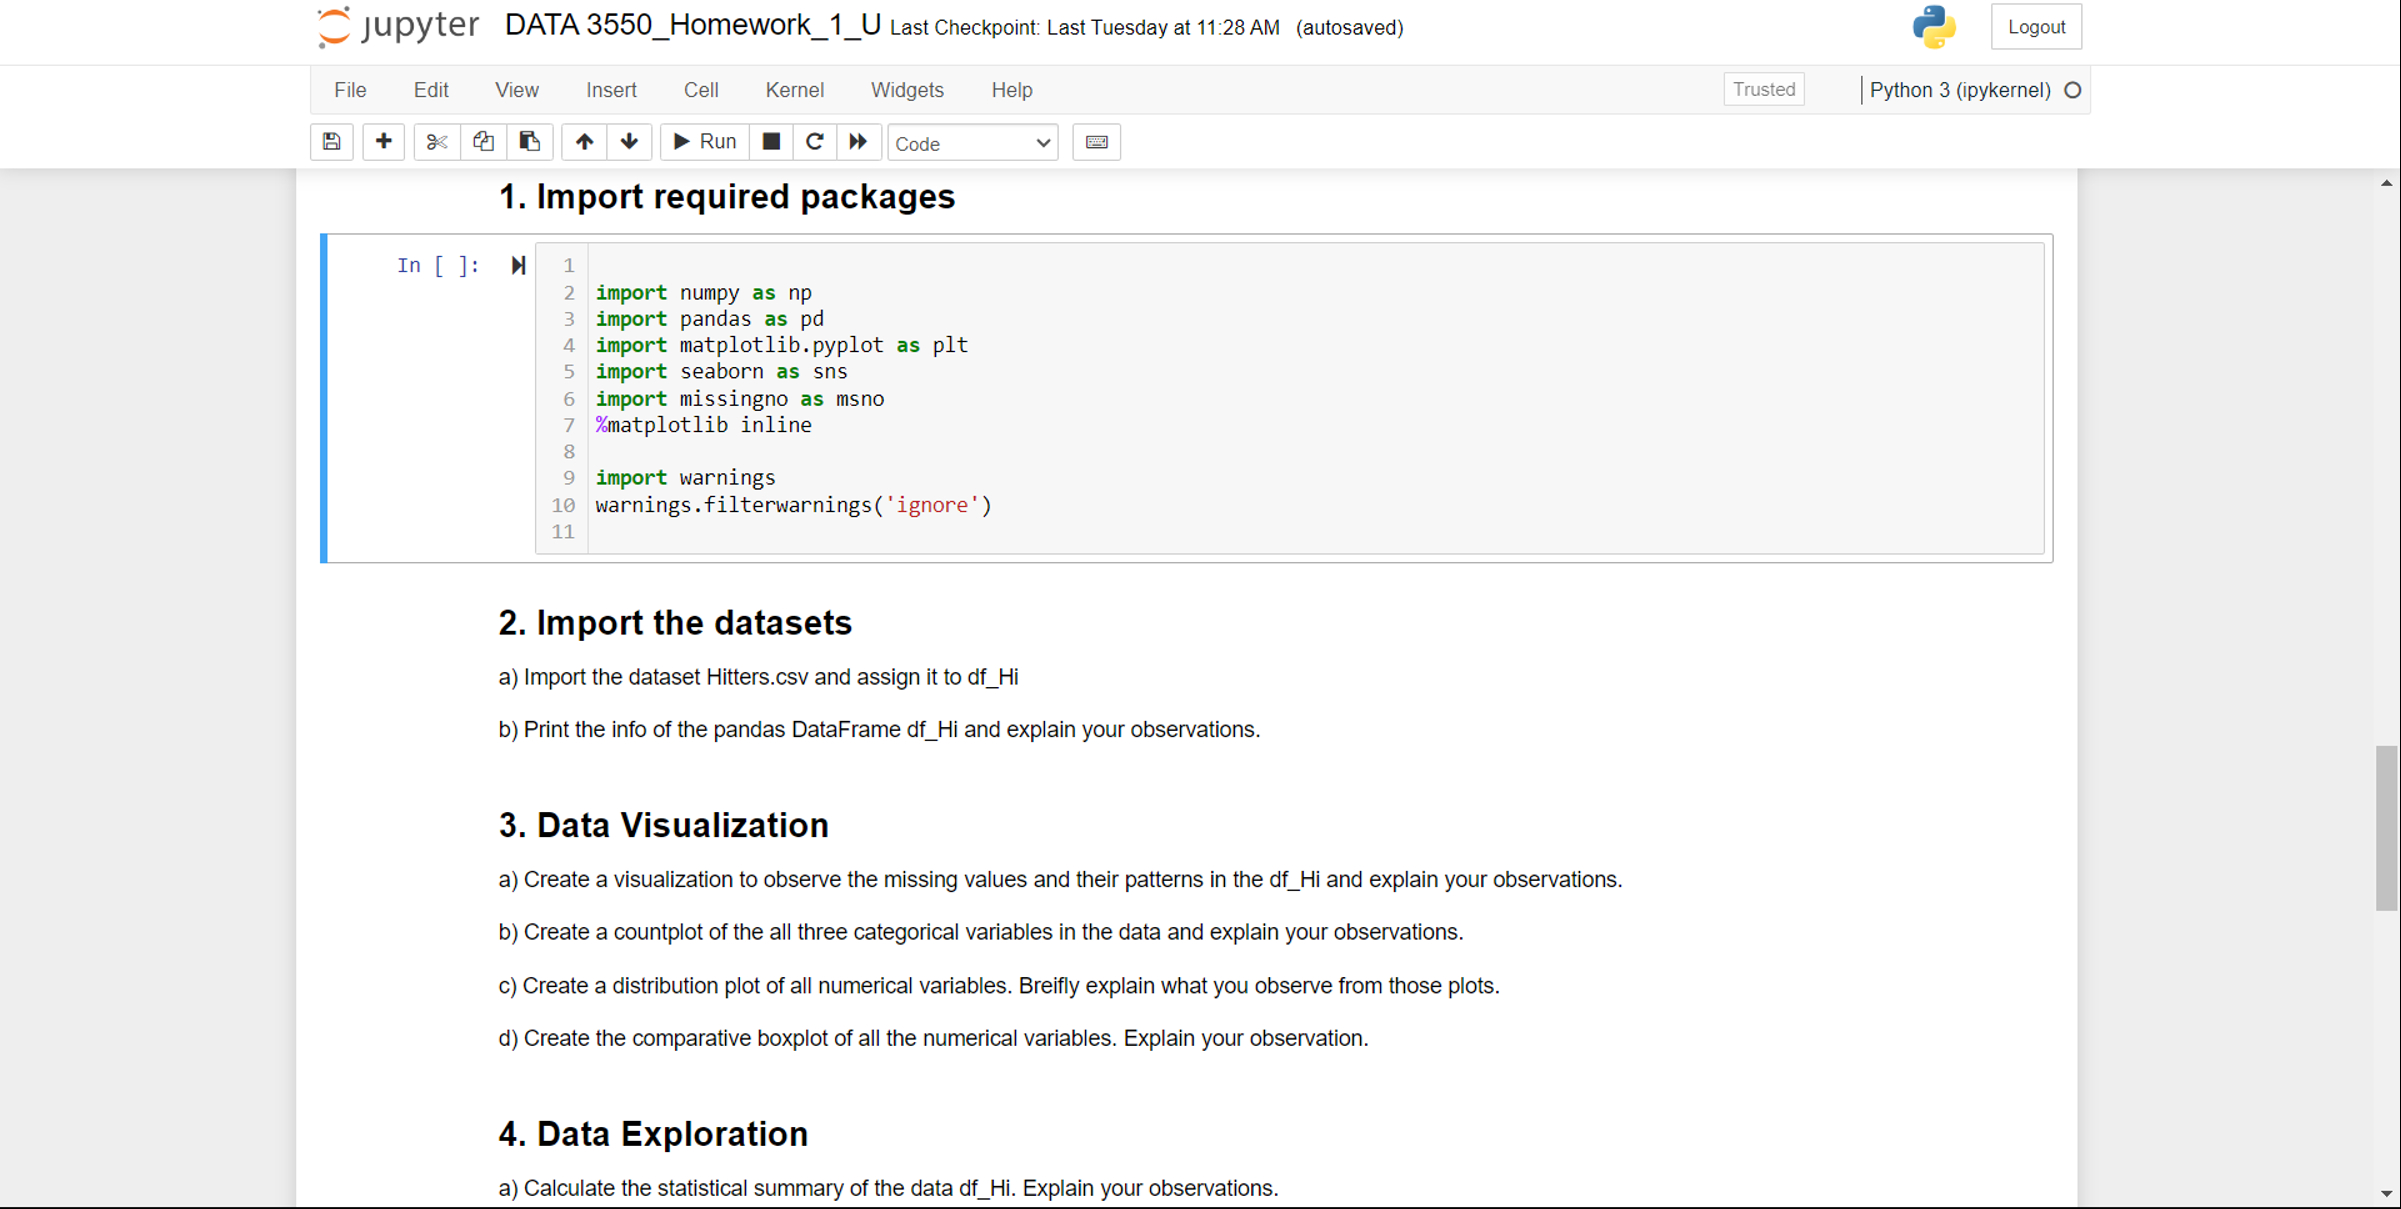
Import required packages
In :
import numpy as np
import pandas as pd
import matplotlib.pyplot as plt
import seaborn as sns
import missingno as msno
matplotlib inline
import warnings
warnings.filterwarningsignore
Import the datasets
a Import the dataset Hitters.csv and assign it to dfHi
b Print the info of the pandas DataFrame dfHi and explain your observations.
Data Visualization
a Create a visualization to observe the missing values and their patterns in the dfHi and explain your observations.
b Create a countplot of the all three categorical variables in the data and explain your observations.
c Create a distribution plot of all numerical variables. Breifly explain what you observe from those plots.
d Create the comparative boxplot of all the numerical variables. Explain your observation.
Data Exploration
a Calculate the statistical summary of the data dfHi Explain your observations.Import the datasets
a Import the dataset Hitters.csv and assign it to dfHi
b Print the info of the pandas DataFrame df Hi and explain your observations.
a Calculate the statistical summary of the data dfHi Explain your observations.
b Observe the unique number of values, most repeated values, and least repeated values of the variables.
c Check if there is any outliers in the dataset.
Imputing Missing Values
Check if there is any missing values in the Salary column of DataFrame dfHi What did you notice?
How do we impute the missing values for dfHi Why did you use that, write your reasoning.
Verify that you correctly imputed the missing values.
Create the Dummy Variables
a Create the dummies of the variable NewLeague. What is the count of each category?
b Create the dummies of the variable League. What is the count of each category?
c Create the dummies of the variable Division. What is the count of each category?
Merge the Data and Perform the Correlation Analysis
a Merge the dummies created with the DataFrame dfHi
b Look at the info of the data, how many variables are there now?
c Create the heatmap that shows the pairwise correlation between all the variables.
d Observe the correlation coefficients and identify the pairs that has a correlation of more than in absolute value.
e Successively drop those variables until there is no variable with the pairwise correlation higher than a Merge the dummies created with the DataFrame dfHi
b Look at the info of the data, how many variables are there now?
c Create the heatmap that shows the pairwise correlation between all the variables.
d Observe the correlation coefficients and identify the pairs that has a correlation of more than in absolute value.
e Successively drop those variables until there is no variable with the pairwise correlation higher than
Transform the data.
a Transform the column Salary to the binary numerical variable as follows: If the Salary is above the median salary assign the value otherwise assign the
value
b Verify that you correctly transformed the data. Observe the count of and in this column after the transformation.
Step by Step Solution
There are 3 Steps involved in it
1 Expert Approved Answer
Step: 1 Unlock

Question Has Been Solved by an Expert!
Get step-by-step solutions from verified subject matter experts
Step: 2 Unlock
Step: 3 Unlock