

Question: just need (d) & (e) begin{tabular}{|l|c|c|c|c|c|} hline 46 Working & 67 & 45 & 73 & 54 & 61 hline %o Management & 51
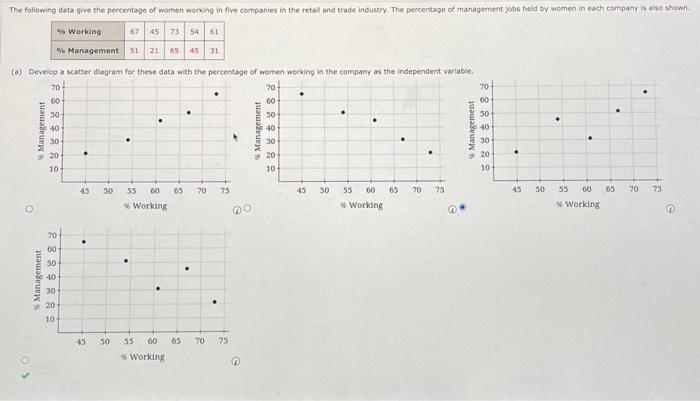
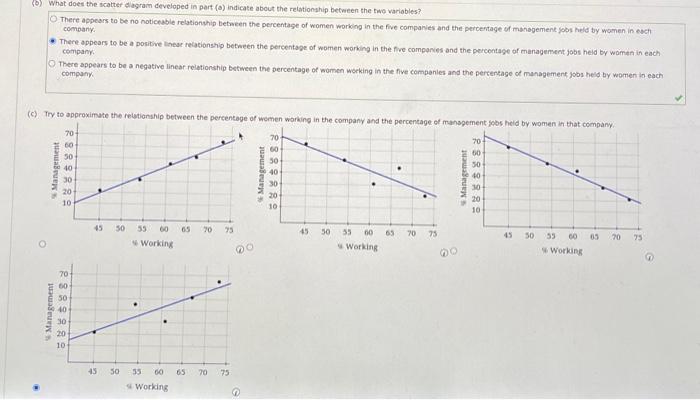
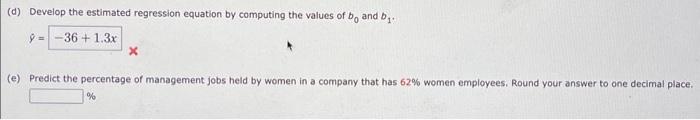
\begin{tabular}{|l|c|c|c|c|c|} \hline 46 Working & 67 & 45 & 73 & 54 & 61 \\ \hline \%o Management & 51 & 21 & 65 & 45 & 31 \\ \hline \end{tabular} (a) Develop a scatter diagram for these data with the percentage of aomien working ln the company as the independent variabie. 4. Working 4. Working (4) Working if Working What does the acatter flagram developed in part (o) indicate about the relationship between the two variables? There appears to be no notichable relationwhip between the percentage of women working in the five companies and the percentage of management pobs held by women in each company There appears to be a posibve lanear relatianship between the percentape of women working in the fire compones and the percentage of management jobs heid by women in each company. There appears to be a negative linear relationship bstween the percentage of women working in the five componies and the pertertage of management jobs held by women ia each compuny. (d) Develop the estimated regression equation by computing the values of b0 and b1. ^= (e) Predict the percentage of management jobs held by women in a company that has 62% women employees. Round your answer to one decimal place. %
Step by Step Solution
There are 3 Steps involved in it

Get step-by-step solutions from verified subject matter experts