

Question: JUST NEED HELP WITH QUESTION B. FINDING THE VALUE FOR Q1 IN THE REGRESSION MODEL Coca-cola Revenues ($ millions ), 2005-2010 Quarter 2005 2006 2007
JUST NEED HELP WITH QUESTION B. FINDING THE VALUE FOR Q1 IN THE REGRESSION MODEL
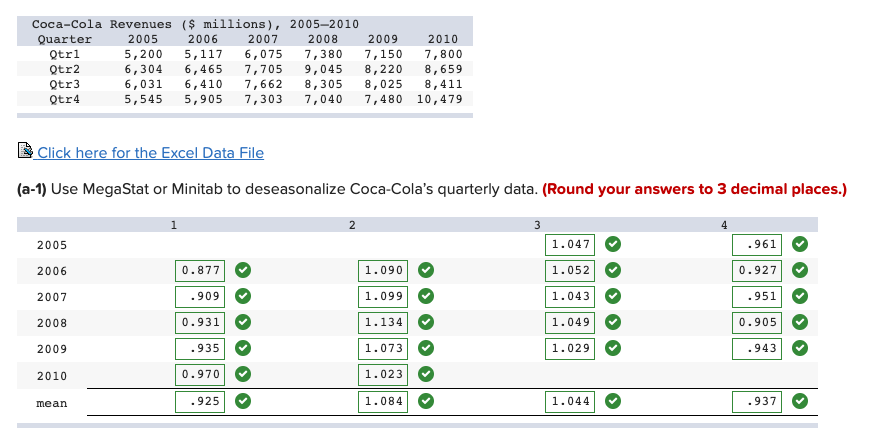
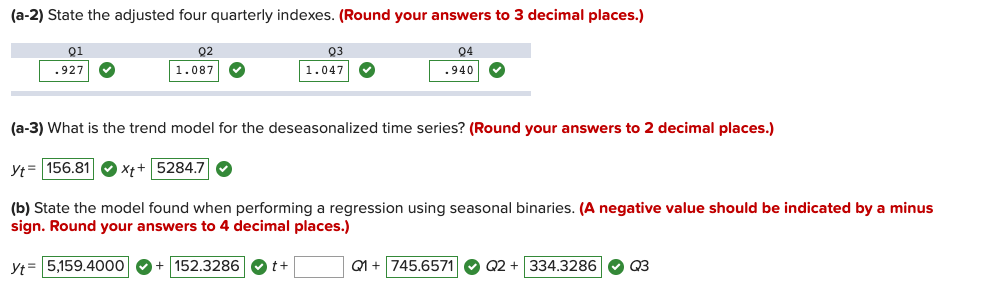
Coca-cola Revenues ($ millions ), 2005-2010 Quarter 2005 2006 2007 2008 2009 2010 Otrl 5, 200 5, 117 6, 075 7,380 7, 150 Otr2 6,304 6,465 7, 800 7, 705 Otr3 9, 045 6,031 8, 220 8, 659 6, 410 7, 662 8, 305 8 , 025 Qtr4 5,545 8, 411 5,905 7,303 7, 040 7, 480 10, 479 * Click here for the Excel Data File (a-1) Use MegaStat or Minitab to deseasonalize Coca-Cola's quarterly data. (Round your answers to 3 decimal places.) 2 3 4 2005 1. 047 . 961 2006 0. 877 1 . 090 1 . 052 0.927 2007 . 909 1. 099 1. 043 . 951 2008 0.931 1. 134 1. 049 0. 905 2009 . 935 1. 073 1. 029 .943 2010 0.970 1. 023 mean . 925 1 . 084 1 . 044 937 O(a-2) State the adjusted four quarterly indexes. (Round your answers to 3 decimal places.) 01 02 03 04 .927 1 . 087 1 . 047 .940 (a-3) What is the trend model for the deseasonalized time series? (Round your answers to 2 decimal places.) 156.81 OXt+ 5284.7 (b) State the model found when performing a regression using seasonal binaries. (A negative value should be indicated by a minus sign. Round your answers to 4 decimal places.) y= 5,159.4000 152.3286 t+ Q1 + 745.6571 Q2+ 334.3286 Q3
Step by Step Solution
There are 3 Steps involved in it

Get step-by-step solutions from verified subject matter experts