

Question: Just Need part C done please: You will use data collected by the entire class during the mark-recapture exercise with beans to address the following.
Just Need part C done please:
You will use data collected by the entire class during the mark-recapture exercise with beans to address the following.
Part A. Calculate the mean of N (estimated population size)at each'effort' using data from the entire class.
Part B. Calculate the standard error of the mean and 95% CIat each'effort" using data from the entire class.
- Calculate the mean of N (estimated population size) at each 'effort' using data from the entire class.
- Calculate the standard error of the mean and 95% CI at each 'effort" using data from the entire class.
We start by taking the square root of the variance of the sample divided by the number of samples:
Effort 1: sqrt(((68-70.2)^2 + (25-70.2)^2 + (5-70.2)^2 + (123-70.2)^2 + (17-70.2)^2 + (74-70.2)^2 + (83-70.2)^2 + (17-70.2)^2 + (51-70.2)^2 + (7-70.2)^2) / 10) = 15.54
Effort 2: sqrt(((109-91.6)^2 + (65-91.6)^2 + (2-91.6)^2 + (108-91.6)^2 + (11-91.6)^2 + (4-91.6)^2 + (196-91.6)^2 + (47-91.6)^2 + (84-91.6)^2 + (98-91.6)^2) / 10) = 28.83
Effort 3: sqrt(((137-104.125)^2 + (79-104.125)^2 + (7-104.125)^2 + (196-104.125)^2 + (39-104.125)^2 + (66-104.125)^2 + (137-104.125)^2 + (14-104.125)^2) / 8) = 29.87
The 95% confidence interval for each effort is calculated by taking the mean +/- 1.96 x standard error.
Effort 1: 70.2 +/- 1.96 x 15.54 = (31.22, 109.18)
Effort 2: 91.6 +/- 1.96 x 28.83 = (32.68, 150.52)
Effort 3: 104.125 +/- 1.96 x 29.87 = (45.30, 162.95)
Part C. In a graph, compare the estimates of mean population size for each of the three sampling efforts. Include error bars that show the standard error and also properly label all axes.
Part D. What happens to the mean and standard error when sampling effort is doubled (two scoops) and then increased again by 50% (three scoops)?
Part E. Assuming cost is an issue, which of the three sample efforts would be the best? (In the sampling of wildlife populations, cost usually is an issue).
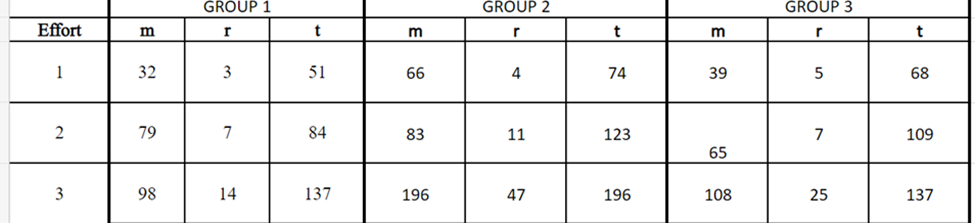
Here is the table required for the required data:
\f
Step by Step Solution
There are 3 Steps involved in it

Get step-by-step solutions from verified subject matter experts